
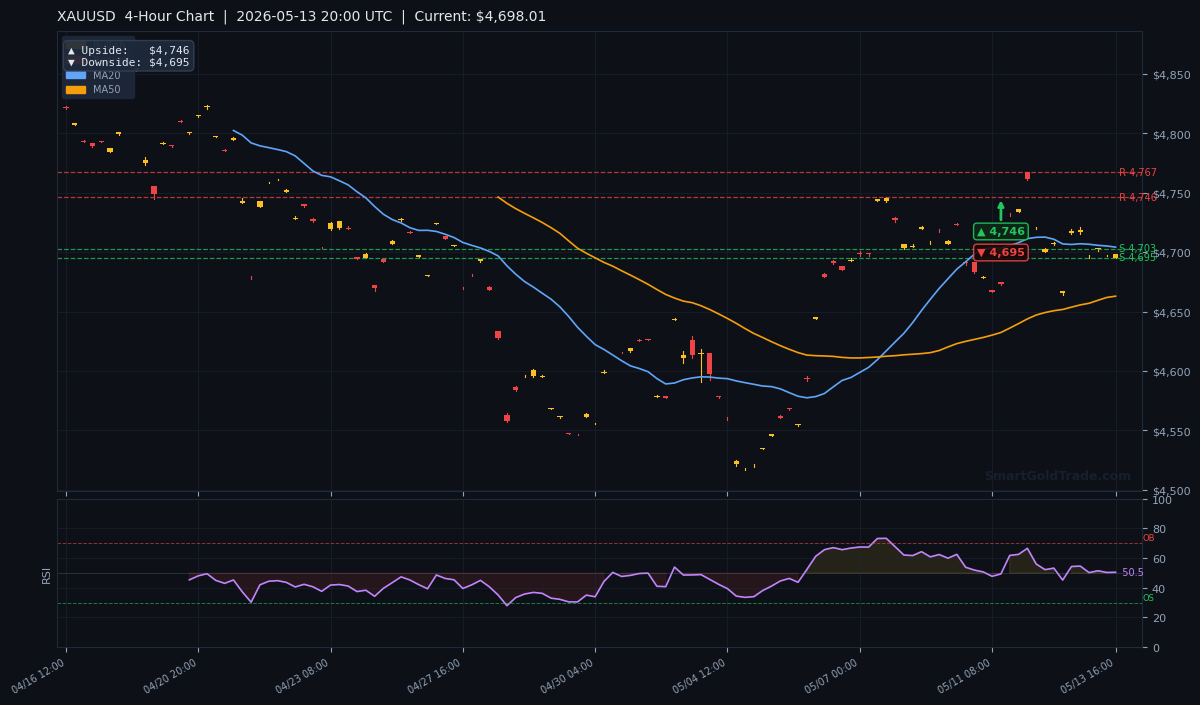
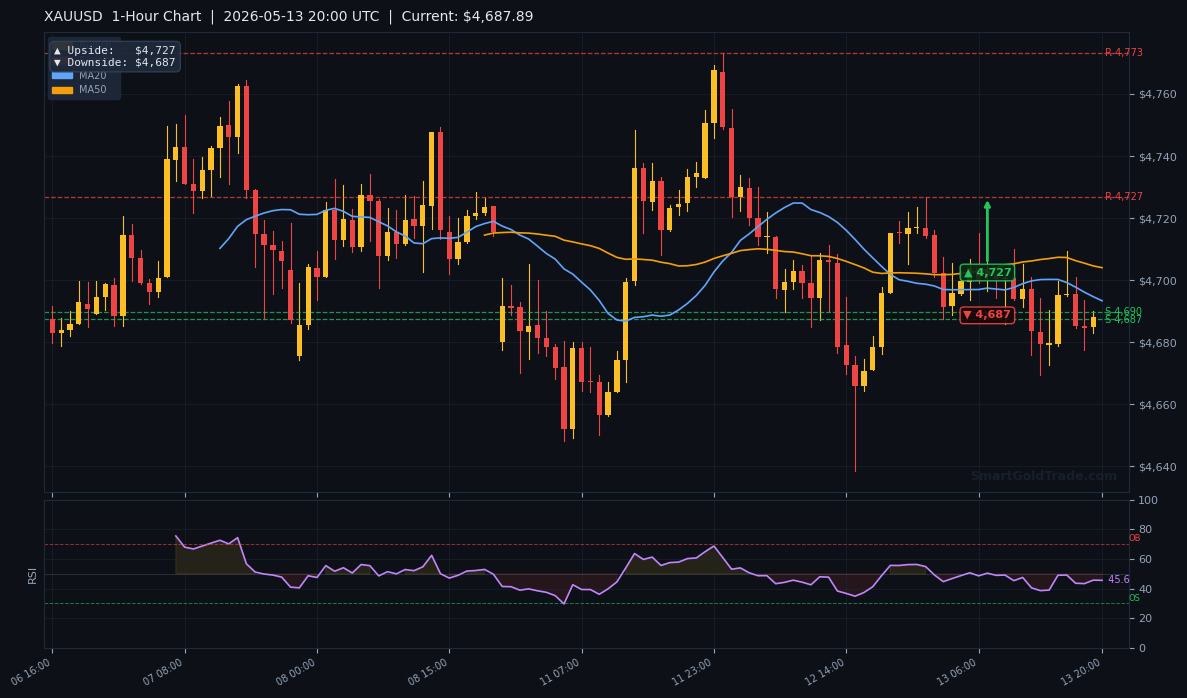
The gold price is hovering near $4,687.69 as the American session gains momentum, with traders still digesting yesterday's April CPI report. According to TD Securities, the headline strength was driven by shelter and energy costs, but core PCE is expected to run softer. This inflation nuance is key for the Federal Reserve's next move. With the H4 chart showing a current price of $4,698.01, the market is at a critical juncture – just below the MA20 while holding above the MA50. The question now is whether bulls can push through the $4,704 resistance to target $4,838, or if bears will drag price back to the $4,683 support. Today's session will likely set the tone for the week.
Gold Market Overview
Macro Context
The US Dollar Index (DXY) remains under pressure following the CPI data, as markets interpret the softer core components as a dovish signal. The 2-year Treasury yield dipped 3 basis points, reinforcing expectations that the Fed may pause rate hikes. Geopolitical tensions in the Middle East continue to provide a floor for gold price, but the immediate driver is inflation trajectory and tariff pass‑through. TD Securities notes that tariff effects are fading, which could cap upside in core PCE. This dynamic keeps the gold price in a consolidation zone.
Session Outlook
During the American afternoon, liquidity tends to thin, which can amplify moves beyond known support and resistance. The gold price is likely to oscillate between $4,683 and $4,704 unless a catalyst emerges. Focus will be on Fed speakers and any further commentary on the CPI report. Watch for a break of $4,704 to open the path toward $4,727 and eventually $4,746 – or a failure that sends gold price back to the $4,683 support.
Technical Analysis
Moving Average Structure
The H4 chart reveals a mixed picture. The MA20 (short‑term) sits at $4,704.14, and price is currently below it – a bearish short‑term signal. However, the MA50 (mid‑term) at $4,662.91 is well below price, confirming a bullish medium‑term trend. The MA200 (long‑term) at $4,692.32 is also below price, indicating that the long‑term bull market remains intact. The EMA structure shows MA20 > MA50, which actually implies short‑term bullish momentum – the gap suggests buyers are stepping in after a dip.
RSI and Momentum
The RSI(14) reads 50.5, squarely in neutral territory. This gives no immediate overbought or oversold signal, meaning the gold price could move either direction with equal force. The ATR(14) is $22.45, indicating that a typical daily range is about $22.45. With price near $4,698, a $22 move would reach either $4,720 on the upside or $4,676 on the downside – both within the current support/resistance framework.
Key Price Levels
| Timeframe | Upside Target | Downside Target |
|---|---|---|
| Daily | $4,838 | $4,683 |
| 4‑Hour | $4,746 | $4,695 |
| 1‑Hour | $4,727 | $4,687 |
Support S1 is $4,702.94 and S2 at $4,695.39. Resistance R1 is $4,767.25 and R2 at $4,745.97. Note that price is currently hovering near S1, which is acting as a magnet. A break below S1 could accelerate the decline toward the daily downside target of $4,683.
Fundamental Drivers
Yesterday's April CPI was the main event. Headline CPI rose 0.3% month‑on‑month, driven by shelter and energy. However, TD Securities economists point out that core PCE – the Fed's preferred gauge – will likely print softer than CPI. The supercore services measure (ex‑housing) is expected to ease as tariff pass‑through fades. This is a key input for the Fed's May meeting minutes and next rate decision.
Key Event to Watch
This week, the most important catalyst is Thursday's weekly jobless claims and a speech by Fed Governor Bowman. Any hawkish tilt could strengthen the dollar and push gold price lower. Conversely, if Bowman echoes the view that inflation is cooling, gold price may challenge the $4,704 resistance. The longer‑term risk is the next FOMC meeting in June.
Devil's Advocate
What could invalidate the bullish bias? A clear breakdown below $4,683 (daily downside target) would signal that sellers have taken control. This level coincides with the low of the previous week and a major demand zone. If gold price closes below $4,683, the next support is $4,667 (recent headlines) and potentially $4,577. The neutral RSI and mixed moving averages give no strong conviction – traders must respect both sides.
Trading Strategy for American Session
For intraday traders, the low‑risk entry is a buy near $4,683 with a stop loss at $4,658 (1 ATR below). Target take‑profit 1 at $4,704 and target 2 at $4,727. Alternatively, a short entry near $4,704 with a stop at $4,726 (1 ATR above) and targets at $4,683 and $4,667. Conservative traders should wait for a confirmation candle – either a bullish engulfing at $4,683 or a bearish rejection at $4,704. For those seeking additional guidance, professional gold trading signals can provide real‑time entry alerts during volatile sessions.
Key Takeaways
- Gold price is trading at $4,687.69 – just above the key daily support of $4,683.
- The MA20 at $4,704.14 is the immediate resistance to watch.
- RSI at 50.5 is neutral – no directional bias from momentum.
- Daily upside target is $4,838.