
Gold Price Under Pressure – $4,683 Support in the Crosshairs
The gold price opened the European session at $4,702.40, hovering just above a critical support zone as traders weigh a mild USD recovery. With momentum fading and the RSI sitting dead on 50, the session presents a clear make-or-break scenario for the precious metal. The latest chart data shows XAUUSD trading at $4,696.23, slightly below the live spot price, reflecting intraday selling pressure. This morning, the USD/CAD pair edged up 0.12% to 1.3695, confirming a modest dollar bid that is capping gold's upside. The next few hours will determine whether bulls defend the $4,683 level or succumb to a deeper correction.
Macro Context
The US dollar index is edging higher, pressuring gold as the yellow metal struggles to hold above $4,700. Treasury yields remain elevated, compressing the non-yielding appeal of bullion. Traders are positioning ahead of this week's US PPI data — any upside surprise would strengthen the dollar and weigh further on gold. Geopolitical tensions, while still present, have taken a back seat to interest rate expectations during the European session.
Session Outlook
European session liquidity is ramping up as London opens. The expected intraday range based on the ATR(14) of $23.11 suggests potential moves between $4,683 and $4,725. A break below the lower boundary would accelerate selling, while a reclaim of $4,720 would shift momentum back to bulls.
Technical Analysis – Mixed Signals
The 4-hour chart reveals a complex picture. The current price of $4,696.23 sits below the MA20 ($4,706.56), confirming bearish short-term momentum. However, it remains above the MA50 ($4,656.96) and the MA200 ($4,688.79), indicating that the medium- and long-term trends are still bullish. This creates a tension between immediate selling pressure and a broader uptrend.
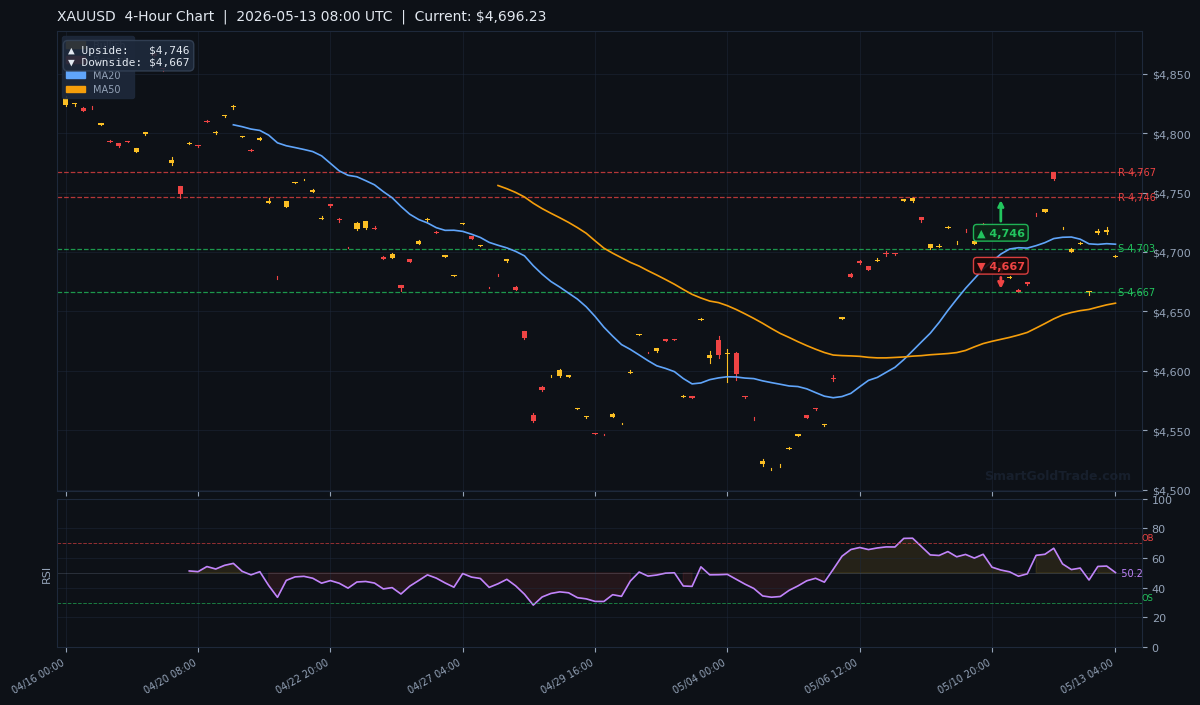
Moving Average Structure
The MA20 ($4,706.56) is below the MA50 ($4,656.96), which might seem contradictory, but the MA20 is the shorter-term average and has turned lower. The EMA structure shows MA20 > MA50, indicating short-term bullish momentum is waning. The MA200 at $4,688.79 is the key floor — as long as price stays above it, the bull market structure remains intact.
RSI and Momentum
The RSI(14) stands at 50.2, perfectly neutral. This provides no directional edge, meaning the next catalyst will decide the breakout. Values below 50 would confirm bearish momentum, while a push above 55 would support a recovery.
Key Price Levels
Support levels from the indicator data: S1 at $4,702.94 and S2 at $4,666.72. Resistance: R1 at $4,767.25 and R2 at $4,745.97. Note that the current price is below S1, meaning S1 now acts as immediate resistance. The 1-hour chart highlights a tighter range.
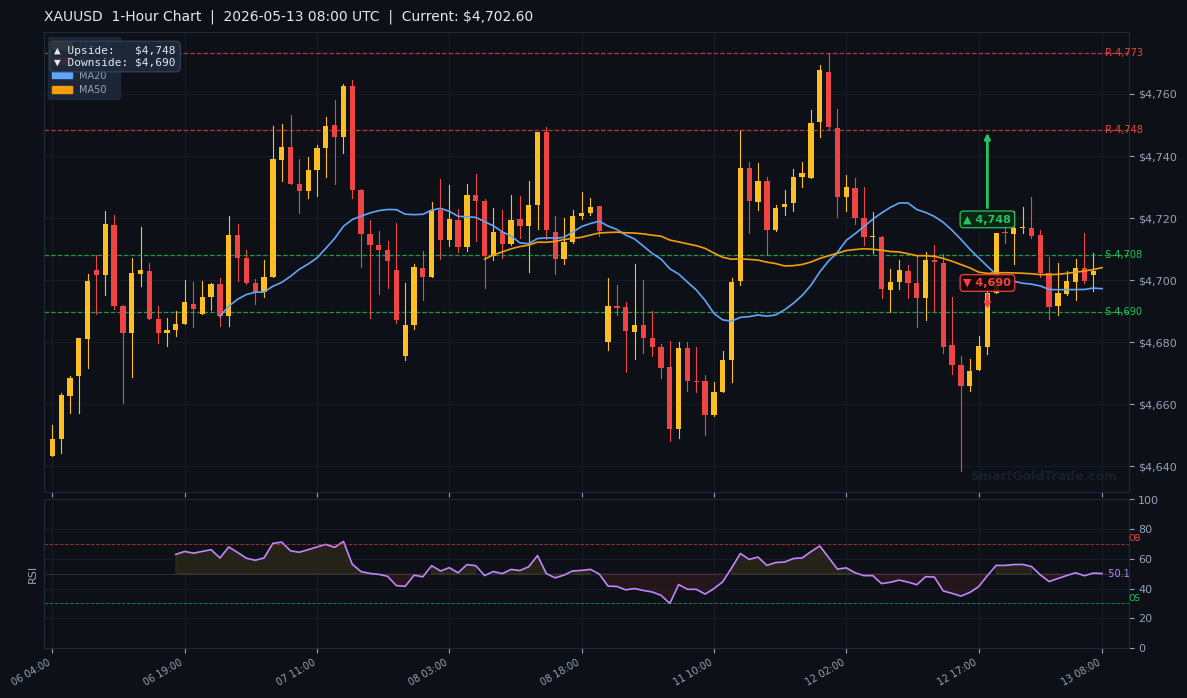
The 1-hour chart shows intraday levels: upside target $4,748, downside target $4,690. With ATR at $23, a break beyond $4,683 (daily downside target) would likely extend to $4,666.
Fundamental Drivers – Dollar Tick Supports Bears
The only relevant news from today's European session is the USD/CAD pair trading 0.12% higher at 1.3695. This reflects a slight preference for the US dollar, which is pressuring gold. Dollar strength reduces gold's appeal for international buyers and weighs on the metal directly. There are no major US releases today, so the dollar's direction will be driven by technical flows and positioning ahead of Thursday's Producer Price Index (PPI).
Key Event to Watch
This week, the most important economic data point is the US PPI release on Thursday, May 14. If producer prices rise more than expected, the dollar could strengthen further, pushing gold toward $4,666 support. A softer reading, however, would give gold a chance to reclaim $4,720 and challenge $4,746 resistance.
Devil's Advocate – What Could Flip the Bias
The bearish scenario assumes the dollar continues to grind higher. However, if geopolitical tensions escalate unexpectedly or if the dollar rally runs out of steam, gold could quickly reverse. A move above $4,702.94 (S1 turned resistance) would invalidate the near-term bearish bias and open the path toward $4,746. Additionally, if the RSI climbs above 55, momentum would shift in favor of the bulls, making any short trade risky.
Trading Strategy for European Session
Entry zone: Look for short entries between $4,696 and $4,700 with confirmation of rejection from the $4,702 level. Stop loss: Place above $4,710 (around 1 ATR) to avoid getting caught in a false breakout. Take profit targets: First target $4,683 (daily downside pivot), second target $4,666 (S2). For traders seeking a long setup, wait for a clear break and retest of $4,703 — then target $4,720 and $4,746. For real-time entry signals, consider subscribing to professional gold trading signals that provide precise entry and exit levels.
Alternative strategy for those seeking a Shariah-compliant approach: use the halal gold trading platform that avoids interest and leverage, allowing physical ownership of gold.
Key Takeaways
- Gold price at $4,702.40 in early European trade, below the MA20 ($4,706.56) – bearish short-term.
- RSI at 50.2 – neutral, no directional bias.
- Key support at $4,683 (daily downside target); a break opens $4,666.
- Resistance at $4,702.94 (S1) and $4,746 (R2).
- Expected intraday range: $4,683 – $4,725 based on ATR of $23.11.
- US PPI on Thursday is the main catalyst this week; dollar direction depends on the outcome.
Conclusion
The gold price remains at a pivotal juncture. With RSI neutral and price below the MA20, bears have the upper hand in the near term. However, the MA200 at $4,688.79 and MA50 at $4,656.96 provide a solid floor. The immediate decision level is $4,702. A sustained break below this zone will confirm the bearish bias toward $4,683 and possibly $4,666. Conversely, a reclaim of $4,703 would shift focus back to $4,746. Traders should stay nimble and manage risk tightly during this low-volatility, event-driven environment.
Frequently Asked Questions
- What is the current gold price?
- The live gold price is $4,702.40 per troy ounce as of 08:00 UTC on May 13, 2026. The technical chart shows a slightly lower print of $4,696.23 due to intraday fluctuations.
- Is $4,683 a strong support level?
- Yes, $4,683 is the daily downside pivot target. If this level breaks, the next support is $4,666.72 (S2). A close below $4,683 would shift the medium-term outlook bearish.
- What are the key resistance levels for gold today?
- Immediate resistance is $4,702.94 (S1 from the indicator data, now acting as resistance). Beyond that, $4,746 (R2) and $4,767 (R1) are the main upside barriers.
- Can gold still rally despite the dollar strength?
- Yes, if geopolitical risks intensify or if US PPI misses expectations on Thursday, gold could reverse. A break above $4,703 would be the first bullish confirmation, followed by a move toward $4,746.
Trading Gold (XAU/USD) carries significant risk of loss and is not suitable for all investors. This content is for informational purposes only and does not constitute financial advice. Always conduct your own research and trade responsibly.