
The gold price is holding near $4,698 at the start of the Asian session on May 14, 2026, as traders digest the latest moves in precious metals — silver continues its six-day winning streak above $86.80. With liquidity thinning in early Asia, the market is showing a classic consolidation pattern. This morning's price action suggests traders are weighing the short-term bullish EMA crossover against a neutral RSI reading. Let's break down what to expect in the coming hours and where the key entry points lie.
Gold Market Overview
Macro Context
The dollar index (DXY) remains under mild pressure after last week's Fed commentary reaffirmed a neutral stance on rates. US Treasury yields have edged lower, providing a supportive backdrop for non-yielding assets like gold. Geopolitical risks around the Iran-US stalemate continue to simmer, but no fresh headline has broken the quiet trading pattern. Markets are positioning cautiously ahead of this week's US housing data and consumer sentiment numbers, both due after today's Asian session.
Session Outlook
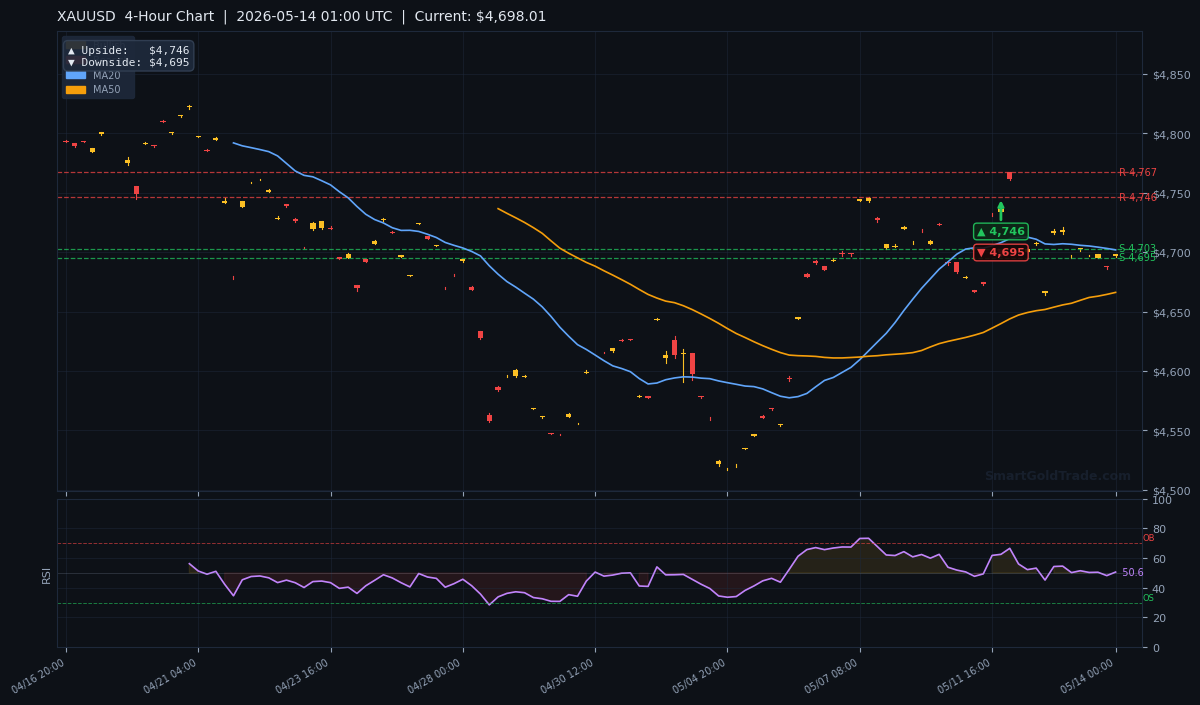
Asian session liquidity is notoriously thin during early hours, and the current range reflects that. The gold price is oscillating between $4,695 and $4,705, well within the expected ATR range of $19.24. Traders should avoid chasing breakouts; the best setups will come from retests of support or resistance levels confirmed by volume. The session bias is neutral-to-bullish, but only above the MA20 at $4,701.85.
Technical Analysis
Moving Average Structure
On the H4 chart, the MA20 sits at $4,701.85, the MA50 at $4,666.08, and the MA200 at $4,694.20. The current price of $4,698.01 is below the MA20 (bearish short-term) but above both the MA50 and MA200 (bullish mid- and long-term). However, note that the EMA structure shows MA20 > MA50, which indicates short-term bullish momentum decelerating. This is a mixed signal that often precedes a directional move once the range resolves.
RSI and Momentum
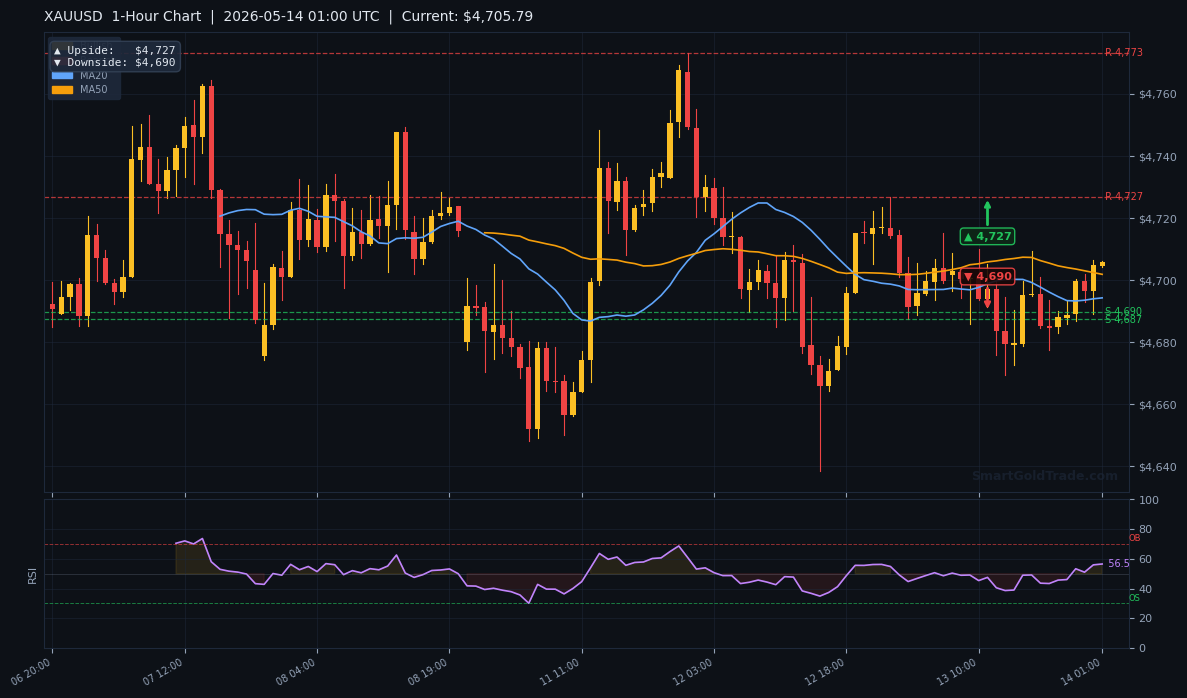
The RSI(14) reads 50.6, squarely in neutral territory. This allows for either a push toward overbought levels above 70 if bulls regain control, or a drop toward oversold below 30 if sellers step in. With no extreme readings, price action alone will dictate the next swing. Momentum oscillators on the H1 chart show a slight bullish divergence, but it is not yet confirmed.
Key Price Levels
From the indicator data, immediate support sits at S1: $4,702.94 and S2: $4,695.39. Resistance levels are R1: $4,767.25 and R2: $4,745.97. The ATR of $19.24 suggests an intraday range of about $38, centering on current price. The pivot arrows on the charts give more actionable targets: daily upside $4,838, daily downside $4,683; 4-hour upside $4,746, 4-hour downside $4,695; 1-hour upside $4,727, 1-hour downside $4,690.
Fundamental Drivers
The main spotlight this week remains on the US consumer sentiment index and existing home sales data due later. However, the primary driver in Asian hours is the spillover from silver's rally. A sustained silver price above $86 could ignite speculative buying in gold as a complementary precious metal. Additionally, the Fed's neutral stance, as confirmed by TD Securities, removes the urgency for a hawkish repricing.
Key Event to Watch
The US housing data release on May 15 will be the first major test for the gold price this week. A stronger-than-expected reading could lift the dollar and push gold toward the $4,683 support, while a miss would likely fuel a rally toward $4,746. Traders should mark their calendars.
Devil's Advocate
What could invalidate our neutral-to-bullish bias? A breakdown below $4,690 (the 1-hour downside pivot) would confirm sellers are in control. The next critical support is the daily downside target of $4,683. If the MA20 fails to attract buyers and the RSI drops below 45, the short-term trend flips bearish. In that scenario, the 4-hour chart would show a lower high, and the earlier EMA crossover would be negated.
Trading Strategy for Asian Session
Given the thin liquidity, patience is key. Look for a retest of the support zone between $4,695 (4H downside pivot) and $4,698 (current price). A bullish candlestick pattern on the H1 chart with above-average volume could be an entry trigger. Set a stop loss at $4,688, just below the 1-hour downside pivot to avoid noise. The first take profit target is the 1-hour upside pivot at $4,727, followed by the 4-hour upside pivot at $4,746. Risk management is essential: with an ATR of $19.24, a stop of $10–$12 on a $30 reward keeps the risk-reward ratio at 1:2.5 or better.
For traders seeking a Shariah-compliant approach, SmartGoldTrade offers interest-free spot gold trading with physical ownership and no leverage. Additionally, those who prefer automated strategies can explore professional gold trading signals for real-time entry alerts.
Key Takeaways
- The gold price is trading at $4,698, below the MA20 but above the MA50 and MA200.
- RSI at 50.6 is neutral, leaving room for either direction.
- Immediate support: $4,695 (S2); resistance: $4,727 (1H pivot) and $4,746 (4H pivot).
- Daily pivot targets: upside $4,838, downside $4,683.
- Asian session expected range: $4,690 – $4,727.
- A break below $4,690 invalidates the bullish case and targets $4,683.
Conclusion
The gold price sits at a technical crossroads this Asian session. Short-term momentum is slightly bullish due to the EMA crossover, but neutral RSI and thin liquidity argue for range-bound trading. The key level to watch is $4,695 — a successful defense could push prices toward $4,727 and beyond. Stay patient, use proper stops, and avoid chasing the market early in the day.
Frequently Asked Questions
- Is gold price bullish today?
- The bias is neutral-to-bullish as long as it holds above $4,695. A move above $4,727 would confirm bullish momentum.
- What is the key support for gold today?
- The strongest support is $4,695 (S2), followed by the daily downside pivot at $4,683.
- What is the key resistance for gold today?
- Immediate resistance is $4,727 (1H pivot) and then $4,746 (4H pivot). A break above the latter could open the door to $4,838.
- How should I trade gold during the Asian session?
- Wait for a retest of the $4,695–$4,698 zone, set a stop at $4,688, and target $4,727. Avoid trading during low volume news lulls.
- Does silver's rally affect gold price?
- Yes, a sustained silver price above $86.80 often drags gold higher due to cross-asset correlation and investor sentiment in precious metals.
Trading Gold (XAU/USD) carries significant risk of loss and is not suitable for all investors. This content is for informational purposes only and does not constitute financial advice. Always conduct your own research and trade responsibly.