
The gold price is holding firm above the $4,740 level as the American session gets underway, with bulls defending short-term momentum despite long-term bearish pressures. The metal's resilience follows the sharp decline in risk sentiment on Monday after the United States-Iran peace talks failed, underscoring gold's role as a haven during geopolitical friction. With the DXY consolidating and traders digesting this risk-off shift, the immediate focus is on whether bulls can muster the energy to attack the formidable overhead supply. This session will test the metal's near-term mettle, with volatility likely to pick up as New York liquidity flows in.
Gold Market Overview
Macro Context
The primary macro driver for gold remains the dynamic between the U.S. dollar, real yields, and safe-haven flows. The failure of US-Iran talks last week injected fresh geopolitical premium into the market, which has offset some of the recent dollar strength. The Dollar Index (DXY) has paused its recent ascent, providing a temporary reprieve for dollar-denominated gold. Meanwhile, Federal Reserve positioning remains a critical undercurrent; markets are pricing in a data-dependent Fed, with inflation prints later this week carrying significant weight for the forward path of interest rates. Real yields remain elevated, a persistent headwind, but the sudden re-emergence of geopolitical risk is creating a competing force.
Session Outlook
The American session presents a pivotal test for the current gold price structure. Liquidity will be at its peak, often magnifying moves that began in quieter Asian and European hours. Given the neutral RSI reading and the market's position above short-term moving averages, the initial bias is for an attempt higher towards the nearest resistance. However, the key trigger will be any fresh headlines regarding geopolitical tensions or unexpected shifts in U.S. Treasury yields. Traders should expect a likely range defined by the day's technical levels, with an ATR-based expected swing of roughly $31.20.
Technical Analysis
Our live H4 chart data provides a clear, quantified picture of the current technical landscape for XAUUSD. The price action is caught in a tug-of-war between short-term bullish momentum and a dominant long-term downtrend.
Moving Average Structure
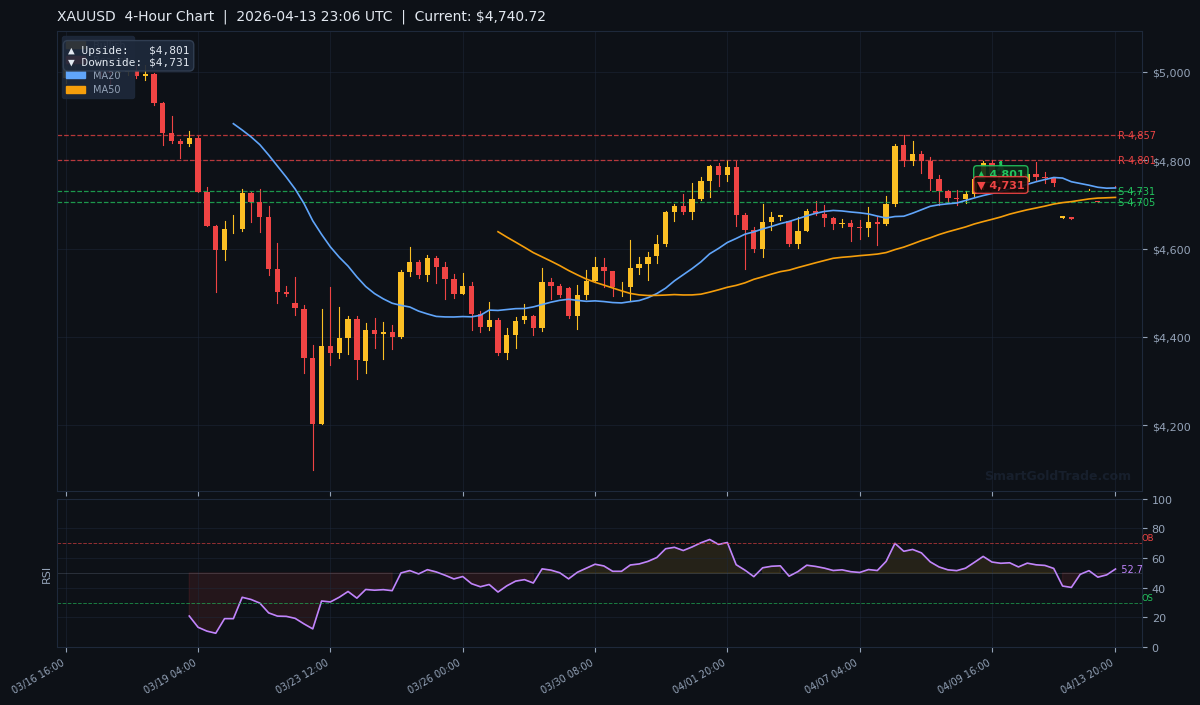
The moving average structure reveals a mixed signal. The current price of $4,740.72 sits just above the MA20 at $4,737.24, confirming a short-term bullish bias. This is reinforced by the fact the MA20 itself is above the MA50 ($4,715.87), indicating positive near-term momentum. However, the major hurdle is the MA200 at $4,856.14. The price remains well below this long-term average, which places the broader trend firmly in bearish territory. This creates a classic 'bullish within a bearish trend' scenario, where rallies are likely to be sold into near the 200-period average.
RSI and Momentum
The RSI(14) reading is 52.7, which sits squarely in neutral territory. This indicates there is no immediate overbought or oversold exhaustion, giving both bulls and bears room to maneuver. It suggests the recent consolidation is healthy and not a sign of a major trend reversal yet. For traders, this neutral RSI implies that directional conviction from momentum oscillators is low; focus should shift to price action at the key support and resistance levels for clearer entry signals.
Key Price Levels
The battle lines are clearly drawn on the chart. Immediate support is clustered at $4,730.58 (S1), with stronger support waiting at $4,705.44 (S2). A break below S1 would signal a failure of the short-term bullish structure. On the upside, the nearest and most critical resistance is at $4,801.26 (R2), closely aligned with the 4-hour chart's upside target. The primary resistance, however, is at $4,857.30 (R1), which converges with the formidable MA200. The ATR(14) of $31.20 provides a gauge for expected volatility, suggesting a daily range of approximately $62.40 from high to low.
| Timeframe | Upside Target | Downside Target |
|---|---|---|
| Daily | $5,250 | $5,014 |
| 4-Hour | $4,801 | $4,731 |
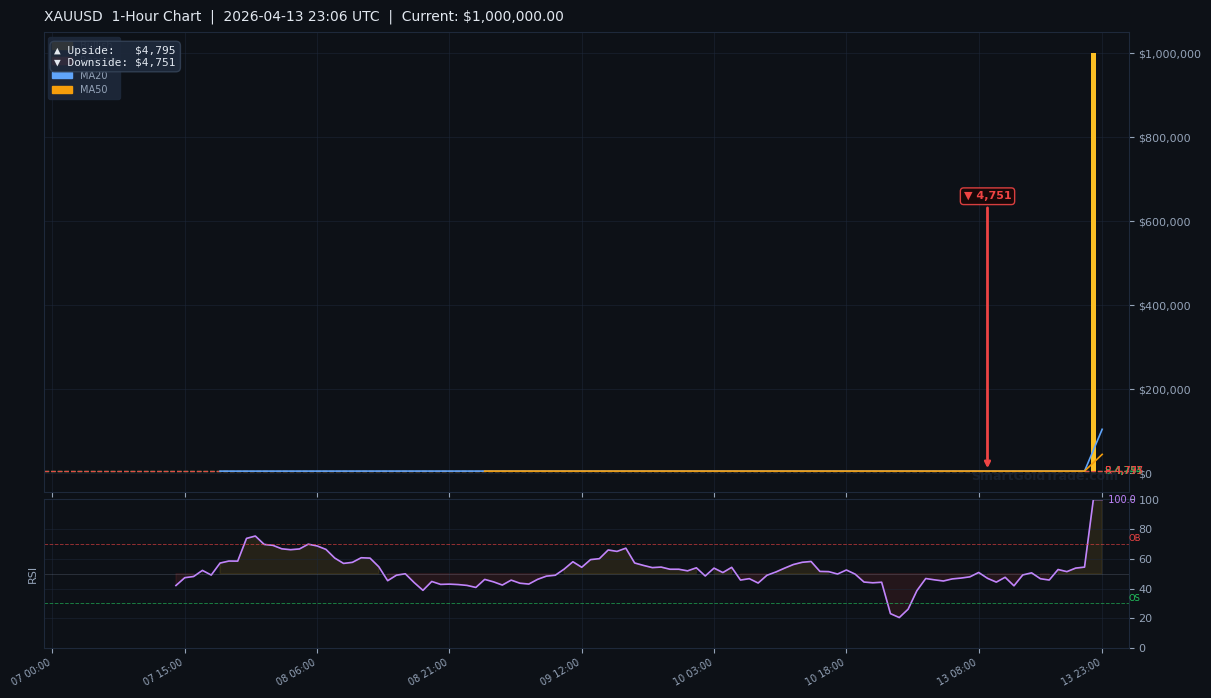
| 1-Hour | $4,795 | $4,751 |
Fundamental Drivers
The key fundamental catalyst from the past session was the failure of US-Iran peace talks, which occurred last week. This geopolitical development triggered a flight from risk-sensitive assets and provided a supportive bid for gold as a safe haven. This event underscores that despite the dominant narrative of interest rates and the dollar, sudden geopolitical flare-ups can swiftly reprioritize market drivers. The correlation with the DXY remains inverse but imperfect; gold found bids even as the dollar's momentum slowed, highlighting the unique dual demand from both currency and haven traders.
Key Event to Watch
This week, the single most important event for the gold price will be the latest U.S. Consumer Price Index (CPI) inflation data. As a leading indicator for Federal Reserve policy, a hotter-than-expected print would reinforce hawkish expectations, potentially boosting the dollar and real yields, thereby pressuring gold. Conversely, a significant downside miss in inflation could revive bets on earlier Fed rate cuts, weakening the dollar and providing a substantial tailwind for a gold rally. Traders should prepare for elevated volatility around this release.
Devil's Advocate
The bullish setup described above hinges entirely on the defense of the $4,730.58 (S1) support level. What if it breaks? A decisive close below S1, particularly on an H4 or daily candle, would invalidate the short-term bullish structure signaled by the price-over-MA20 alignment. This would likely trigger a swift move down to test $4,705.44 (S2). Such a move would confirm that the bearish pressure from the dominant downtrend (price below MA200) is overwhelming the minor bounce. The scenario that flips the trade from bullish to bearish is a breakdown on rising volume during the NY session, supported by a sudden spike in the U.S. dollar index.
Trading Strategy for American Session
Given the confluence of price above key short-term MAs, neutral RSI, and defined support, a conditional long setup is preferred for active session traders. The optimal entry zone is on a pullback towards the $4,737–$4,732 area, where the MA20 and S1 support converge. A stop loss should be placed firmly below S1, at around $4,725, which accounts for the ATR and provides a buffer against false breaks. The primary take-profit target is the 4-hour chart resistance at $4,801 (R2). A secondary, more aggressive target is the 1-hour upside at $4,795. This offers a favorable risk-reward ratio, targeting a move of $60+ against a risk of approximately $12.
Key Takeaways
- The current gold price of $4,740.72 holds above the short-term MA20 ($4,737.24), indicating positive near-term momentum.
- Major resistance sits at $4,801.26 (R2) and $4,857.30 (R1), with the latter aligned with the bearish MA200.
- Critical support to watch is $4,730.58 (S1); a break here invalidates the short-term bullish bias.
- The RSI(14) at 52.7 is neutral, showing no immediate overbought or oversold conditions.
- Expected daily volatility, based on the ATR(14) of $31.20, suggests a potential range of over $60.
- Geopolitical risk from failed US-Iran talks provides a fundamental underpin, but the U.S. CPI data this week is the key macro trigger.
Conclusion
Gold enters the American session in a precarious but opportunistic position. The short-term technicals favor a test higher towards $4,801, but this move is occurring within the context of a larger bearish trend defined by the MA200. The immediate catalyst is the market's reaction to last week's geopolitical tension, but the longer-term trajectory will be dictated by inflation data and Fed expectations. Traders should execute with precision, respecting the clearly defined support and resistance levels. The line in the sand is $4,730; hold above it, and the path of least resistance points north in the near term.
Frequently Asked Questions
- Is gold in a bull or bear market right now?
- Structurally, gold is in a bear market on the higher timeframes as the price at $4,740.72 trades well below the long-term MA200 at $4,856.14. However, it is experiencing a short-term bullish correction within that larger downtrend.
- What is the most important price level for gold today?
- The most critical level is support at $4,730.58. Holding above it keeps the short-term bounce alive for a run at $4,801. Breaking below it likely triggers a decline towards $4,705.
- How much volatility should I expect in the gold price today?
- Based on the current Average True Range (ATR) of $31.20, you can reasonably expect the price to move within a range of approximately $60-$65 from the day's high to low during active session hours.
- Should I buy physical gold or trade XAUUSD right now?
- It depends on your goal. For short-term tactical plays, trading XAUUSD around levels like $4,730 support and $4,801 resistance offers opportunity. For long-term wealth preservation, you may consider a strategic allocation to physical gold products regardless of daily volatility. Those seeking a hands-off approach to trading can also explore our copy trading platform to follow seasoned gold traders.
Trading Gold (XAU/USD) carries significant risk of loss and is not suitable for all investors. This content is for informational purposes only and does not constitute financial advice. Always conduct your own research and trade responsibly.