
The gold price near $4,502 is wobbling as European traders enter the fray, with FXStreet chatter debating whether a bullish reversal is finally taking shape or if this is just a dead-cat bounce. Last Wednesday’s FOMC minutes showed a committee in no rush to cut rates, and the metal has struggled to reclaim its 50-period moving average since. The lingering question this morning isn’t whether bulls can break higher; it’s whether the bears can shove spot gold through the $4,489 floor before the US open. If that level fails, a swift retest of deeper support looks inevitable.
Gold Market Overview
Macro Context
The US Dollar Index (DXY) is trading at 100.5, essentially flat on the session, failing to provide either a tailwind or headwind for the yellow metal. US 10-year Treasury yields eased to 4.28% after last week’s US services PMI came in at 48.9 — a sharp contraction that reignited growth fears. Markets are now pricing a 24% chance of a July rate cut, up from 18% before the data, but still far from a consensus. Geopolitically, reports of Israeli airstrikes near Tehran continue to underpin a safe-haven bid, keeping the gold price from collapsing outright despite the technical headwinds.
Session Outlook
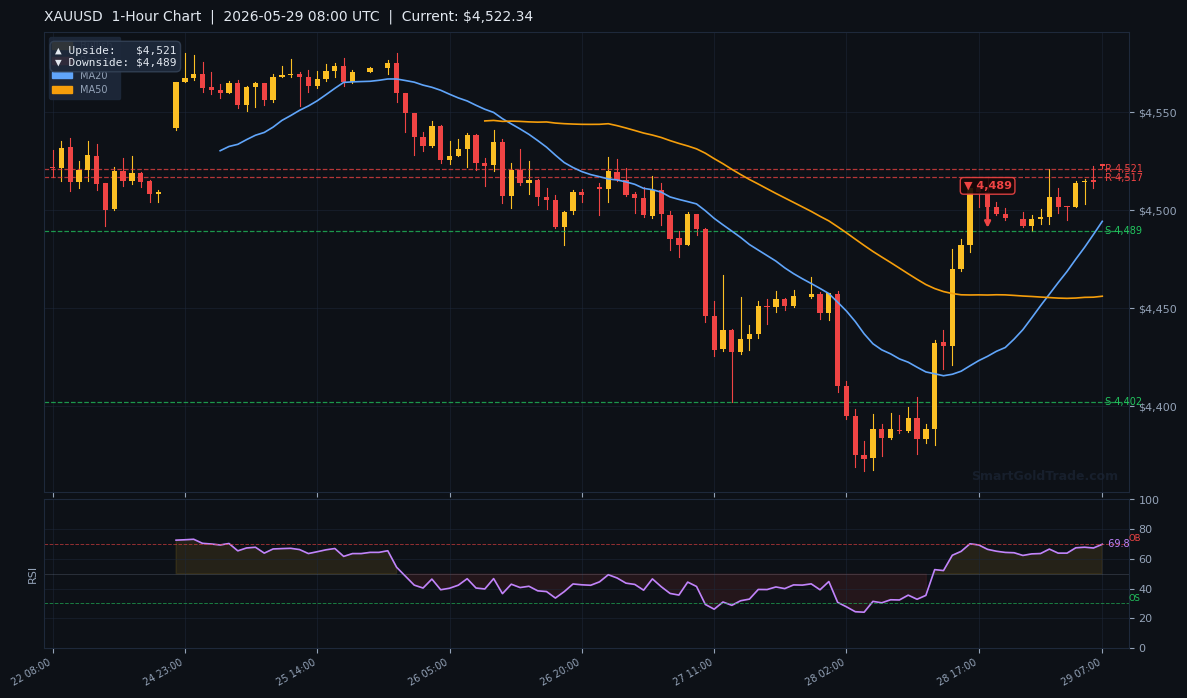
London desks are fully online and liquidity is thickening, but so is volatility. The 1-hour average true range (ATR) sits at $24.49, suggesting we could easily see a $25–30 swing before the US cash session. The early price action points to a range held between $4,489 and $4,521 — the 1-hour pivot extremes. If the DXY starts to tick higher during the European afternoon, the gold price will likely grind toward the lower boundary. The main catalyst today is the lack of top-tier data, leaving technical levels to dominate order flow, though traders will still watch for any surprise headlines from the Middle East or Fed speakers later.
Technical Analysis
Moving Average Structure
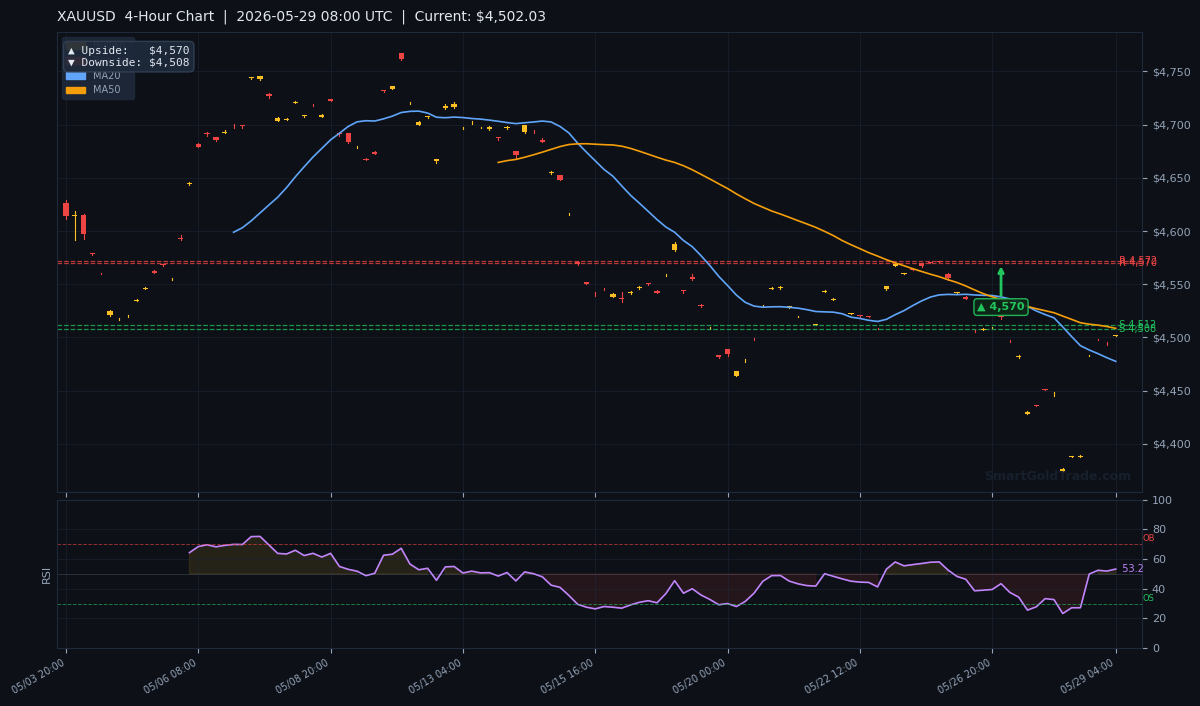
The moving average cluster paints a conflicted picture. The 20-period MA at $4,477.46 is sloping higher and price is currently above it, indicating short-term bullish momentum. However, the 50-period MA at $4,508.49 and the 200-period MA at $4,638.62 both hover well above price, confirming the medium- and long-term downtrend. The EMA structure shows MA20 < MA50, which is a classic short-term bearish pressure signal despite the shallow bounce. As long as spot gold stays beneath the 50-MA, any rally will be treated as corrective.
RSI and Momentum
The 14-period RSI stands at 53.2, right in the middle of the neutral range. It’s neither overbought nor oversold, giving no clear directional cue. However, the RSI has been drifting lower from 58 over the last four hours, hinting that sellers are slowly gaining the upper hand. A break below 50 on the RSI would align with a breach of the $4,489 support, amplifying bearish momentum. Until then, the indicator supports a wait-and-watch stance.
Key Price Levels
The technical landscape reveals a stark imbalance: all the major pivot supports — $4,541.85 and $4,533.06 — sit well above the current gold price of $4,502.03. These zones previously acted as floors and now constitute overhead resistance. Even more remote are the resistance levels at $4,589.39 and $4,571.76. In practice, until gold manages to reclaim $4,533, the path of least resistance is lower. The following table consolidates the pivot arrow targets across timeframes:
The ATR of $24.49 implies an expected session range of roughly $24–25, meaning even a routine move could test either the $4,521 resistance or the $4,489 support before the day ends.
Fundamental Drivers
FXStreet’s headline ‘Gold bullish reversal?’ captures the market’s uncertainty perfectly. The catalyst behind that question was likely last Thursday’s US existing home sales print, which tumbled -4.7% against an expected -2.1%. That data, combined with the earlier services PMI miss, has nudged rate-cut expectations higher, a tailwind for non-yielding assets like gold. At the same time, the DXY has been unable to break above 101.5, strengthening the floor under the metal. However, the positive correlation between the gold price and real yields has weakened lately, suggesting safe-haven flows are doing the heavy lifting rather than macro rebalancing.
Key Event to Watch
Next Monday’s ISM manufacturing PMI for May is the week’s marquee release. A reading below 48.0 would fuel recession chatter and likely send the gold price surging toward the $4,533 resistance zone. A print above 50.5, on the other hand, could accelerate the bearish scenario, cracking $4,489 and opening the door to the 4-hour downside target of $4,508 first, then the daily support at $4,667 later in the week.
Devil’s Advocate
The bearish case hinges on the $4,489 1-hour support breaking cleanly. If it doesn’t — and instead price pushes back above $4,521 — the entire short bias unravels. A close above the $4,533 level (S2 resistance) during the European session would flip the structure bullish and target the 4-hour upside of $4,570. The neutral RSI gives ample room for such a reversal, especially if a sudden geopolitical shock triggers a wave of safe-haven buying. Traders interpreting the FXStreet reversal narrative too literally could get squeezed if stops pile up above $4,533.
Trading Strategy for European Session
The primary setup is a reactive short on a confirmed break of $4,489. A 15-minute close below this level with volume would trigger an entry toward the $4,508 4-hour target, with an extended aim at $4,500 round number support. Using the 14-period ATR of $24.49, a suitable stop-loss sits at $4,521, just above the 1-hour upside pivot, giving a risk of about $32. The initial take-profit at $4,500 yields roughly a 1:0.6 risk-reward, but those willing to hold for a deeper flush can target $4,489 break continuation toward $4,470. Alternatively, aggressive bulls can watch for a bounce from current levels with a stop below $4,489 and a target at $4,521.
For traders wanting to remove emotion from the execution, supplementing manual analysis with professional gold trading signals can provide timely entry alerts as levels get tested. Meanwhile, those who prefer to trade gold in a fully Shariah-compliant manner can explore interest-free spot gold trading on our platform, where every trade corresponds to physical allocated metal.
Key Takeaways
- The gold price is pinned near $4,502, with the 1-hour downside target at $4,489 acting as the line in the sand for the European session.
- Moving averages show short-term bullishness (MA20 at $4,477) overshadowed by mid-term bearish pressure from MA50 at $4,508 and MA200 at $4,638.
- RSI at 53.2 gives no edge, but a slide below 50 would confirm selling momentum if price breaks $4,489.
- All traditional pivot supports — $4,541 and $4,533 — have become overhead resistance, making rallies capped until those levels are reclaimed.
- The ATR of $24.49 suggests a typical daily swing that could hit the $4,521 resistance or the $4,489 support well before the US session.
- Next Monday’s ISM manufacturing number is the high-impact event that could define the gold price direction for the coming week, with a print below 48 fueling a rally toward $4,533.
Conclusion
Bears are running the show in the European morning as the gold price clings to $4,502 with the $4,489 1-hour pivot just inches away. The weight of the 50- and 200-period moving averages above, combined with former supports now acting as resistance, creates a hostile environment for bulls. Unless spot gold can muster a rally above $4,533, every bounce is a selling opportunity. The tactical plan is straightforward: wait for the $4,489 break, then follow the momentum down to $4,508 and potentially lower. Keep an eye on the ISM whisper numbers next week — they will determine whether this bearish bias has legs or gets flipped.
Frequently Asked Questions
- What is the most important level for gold price today?
- The $4,489 1-hour support is the critical threshold. A sustained break below it opens the path to the 4-hour downside target of $4,508, while holding it could trigger a bounce toward $4,521.
- Why is the gold price under pressure despite a weaker DXY?
- Short-term relief from a DXY at 100.5 is being offset by the technical damage done earlier: price is trading below the 50-MA at $4,508 and the 200-MA at $4,638, keeping sellers in control.
- When should I consider a long trade on gold?
- A bullish entry becomes viable only if the gold price reclaims $4,533 on a 4-hour close. Until then, the bearish structure remains intact and long positions carry elevated risk.
- How much can gold move in the European session today?
- With an ATR of $24.49, the realistic range is $25–30. This means price could easily test either $4,489 or $4,521 within the session, depending on the catalyst.
- What is the next major news event for gold traders?
- Monday’s ISM manufacturing PMI is the one to watch. A contraction below 48.0 could propel gold toward $4,533, while a strong print above 50.5 would intensify bearish pressure toward the daily downside at $4,667.
Trading Gold (XAU/USD) carries significant risk of loss and is not suitable for all investors. This content is for informational purposes only and does not constitute financial advice. Always conduct your own research and trade responsibly.