
The gold price surged above $4,508 during the American session on Tuesday, reacting sharply to a breakdown in the U.S. Dollar Index toward the 99.10 region. The move comes as traders reposition ahead of the upcoming Federal Reserve leadership transition, adding fresh momentum to the precious metal. With the dollar under pressure, gold bulls are now eyeing a run toward the daily upside pivot of $4,838.
Gold Market Overview
Macro Context
The DXY slide below 99.10 marks its lowest level in weeks, triggered by growing uncertainty around the Fed’s next chair. Market participants are pricing in a slower pace of rate hikes, which historically benefits gold. Meanwhile, U.S. Treasury yields remain subdued, with the 10-year note hovering near 4.15%, further reducing the opportunity cost of holding non-yielding assets.
Session Outlook
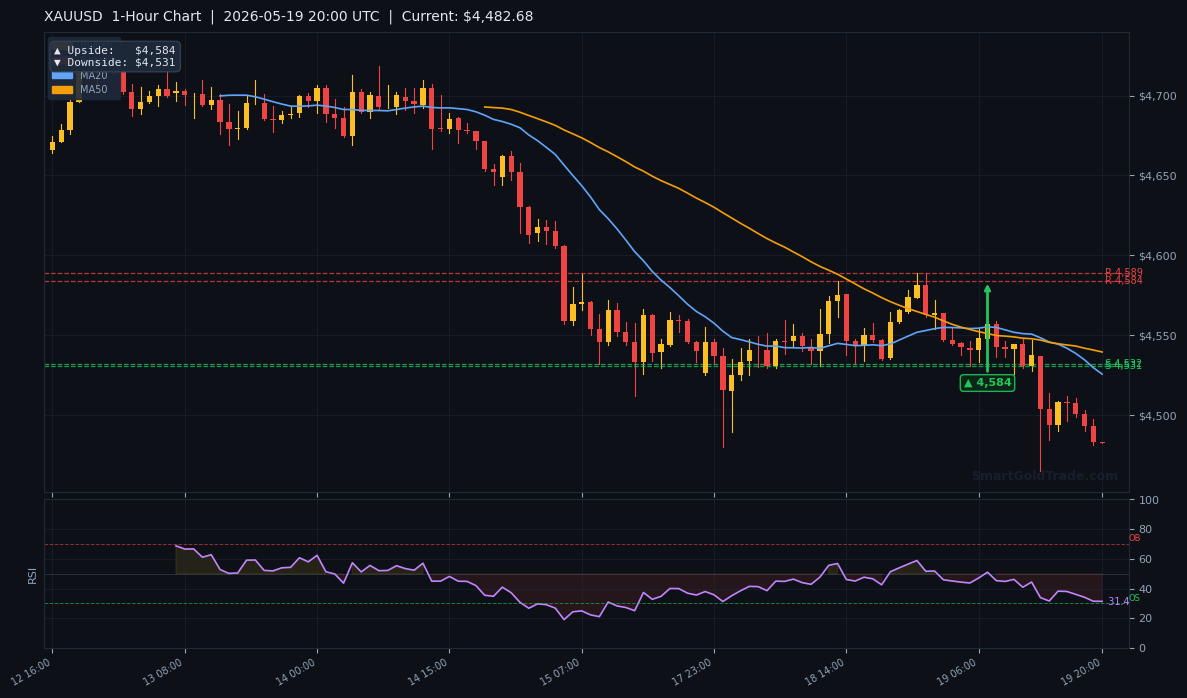
During the American session, liquidity tends to spike, and today’s dollar rout is amplifying volatility. The gold price has already broken above the 1-hour resistance zone, and a sustained move above $4,584 (the 1-hour upside target) could catalyze a fast rally toward $4,724 and eventually $4,838. Key triggers include any further weakness in the dollar or headlines about the Fed succession.
Technical Analysis
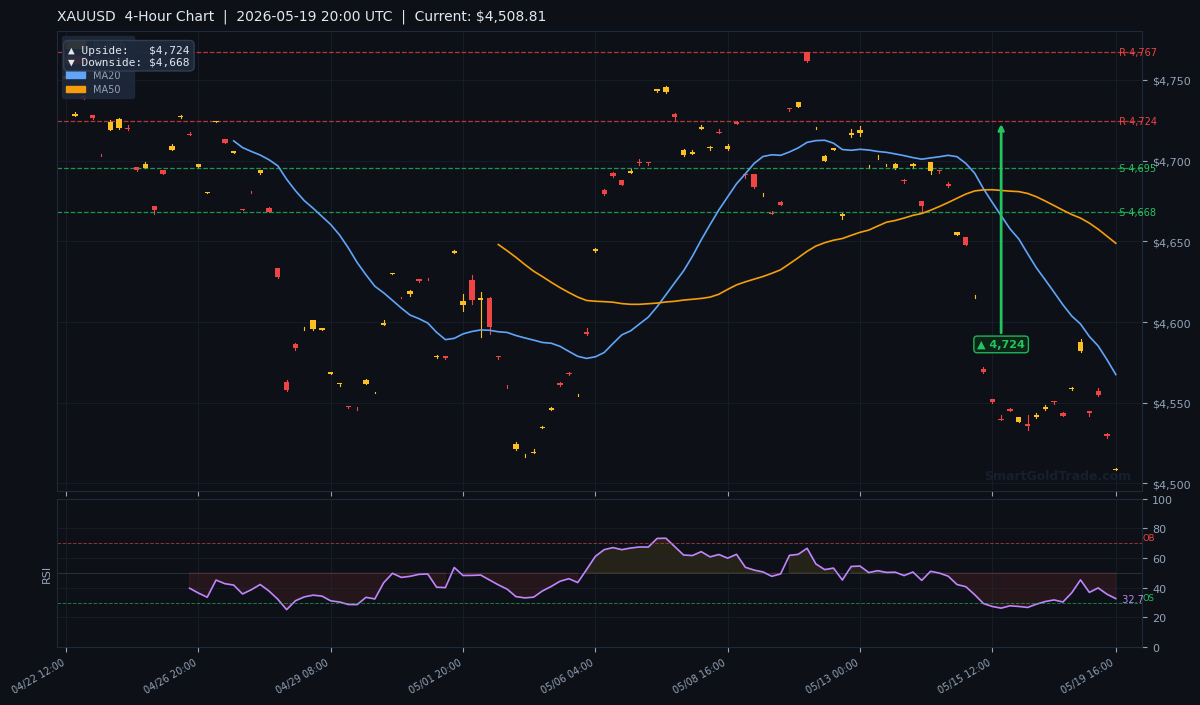
Using the H4 and H1 chart data from May 19, 2026 20:00 UTC, the technical picture reveals a market that is oversold on multiple timeframes, setting the stage for a counter-trend rally.
Moving Average Structure
The MA20 sits at $4,567.45, the MA50 at $4,648.80, and the MA200 at $4,689.45. The current gold price of $4,508.81 is below all three, confirming a bearish trend on the short and medium term. However, price is now testing the underside of the MA20, and a break above it would signal the first shift in momentum.
RSI and Momentum
The RSI(14) reads 32.7, which is in neutral territory but close to oversold conditions. This suggests that while selling pressure remains, the market is not yet exhausted. A move above 35 would confirm buying interest is returning.
Key Price Levels
Based on the pivot arrows drawn on the attached charts, the critical levels are as follows:
| Timeframe | Upside Target | Downside Target |
|---|---|---|
| Daily | $4,838 | $4,667 |
| 4-Hour | $4,724 | $4,668 |
| 1-Hour | $4,584 | $4,531 |
The ATR(14) of $15.57 indicates that an expected daily range of roughly $15–$16 is normal. Given today’s breakout, we could see a move closer to $4,584 before the session closes.
Fundamental Drivers
The primary driver today is the sharp decline in the U.S. Dollar Index, which fell toward 99.10 after a surprise drop in Treasury yields. The catalyst appears to be uncertainty surrounding the upcoming Federal Reserve leadership transition, as market participants weigh the possibility of a more dovish successor. This has eroded dollar demand and boosted gold.
Key Event to Watch
The single most important event this week is the Fed Chair nomination hearing scheduled for Thursday. Any hints of a policy shift could send the gold price either toward $4,838 if dovish, or back toward $4,667 if the nominee adopts a hawkish tone.
Devil's Advocate
Despite the bullish breakout, a failure to hold above the 1-hour support level of $4,531 would invalidate the upside bias. If the DXY rebounds from 99.00 and reclaims 100, gold could quickly reverse. Watch the $4,531 level as the line in the sand—if broken, expect a retest of $4,468, the next key support.
Trading Strategy for American Session
For bullish setups, look for entries near the current price of $4,508 with a stop loss placed just below the 1-hour downside target at $4,525 (2× ATR adjustment). The first take-profit target is $4,584 (1-hour upside), followed by $4,724 (4-hour upside). Risk management is critical; use a maximum risk of 1% per trade. For traders who prefer following expert analysis, our copy trading platform allows you to mirror top-performing gold traders automatically.
Key Takeaways
- The gold price surged above $4,508 as the DXY cratered toward 99.10.
- Technical indicators remain bearish, but oversold conditions support a bounce toward $4,584.
- The daily upside target of $4,838 is the next major resistance above $4,724.
- A break below $4,531 would invalidate the bullish case and target $4,468.
- The ATR of $15.57 suggests a daily range expansion of roughly $15–$16 is likely.
- Fundamentals are dollar-driven; the Fed Chair hearing on Thursday is the key event.
Conclusion
The gold price is enjoying a strong uplift from a crumbling U.S. dollar, with bulls targeting $4,838 in the days ahead. While the moving average structure remains bearish, momentum is shifting, and a break above the MA20 ($4,567.45) would confirm the trend reversal. Traders should keep a close eye on the 1-hour support at $4,531 and the upcoming Fed news. If the dollar continues to weaken, gold has a clear path higher.
Frequently Asked Questions
- What is the current gold price?
- As of 20:00 UTC on May 19, 2026, gold (XAU/USD) is trading at $4,508.81.
- Why is gold price rising today?
- The decline in the U.S. Dollar Index toward 99.10, driven by Fed leadership uncertainty, is pushing gold higher.
- What are the key resistance levels for gold?
- Key resistances are $4,584 (1-hour), $4,724 (4-hour), and $4,838 (daily).
- What is the stop loss level for a long gold trade today?
- A stop loss below the 1-hour downside target of $4,531 is recommended, around $4,525 for added buffer.
Risk Disclaimer: Trading Gold (XAU/USD) carries significant risk of loss and is not suitable for all investors. This content is for informational purposes only and does not constitute financial advice. Always conduct your own research and trade responsibly.