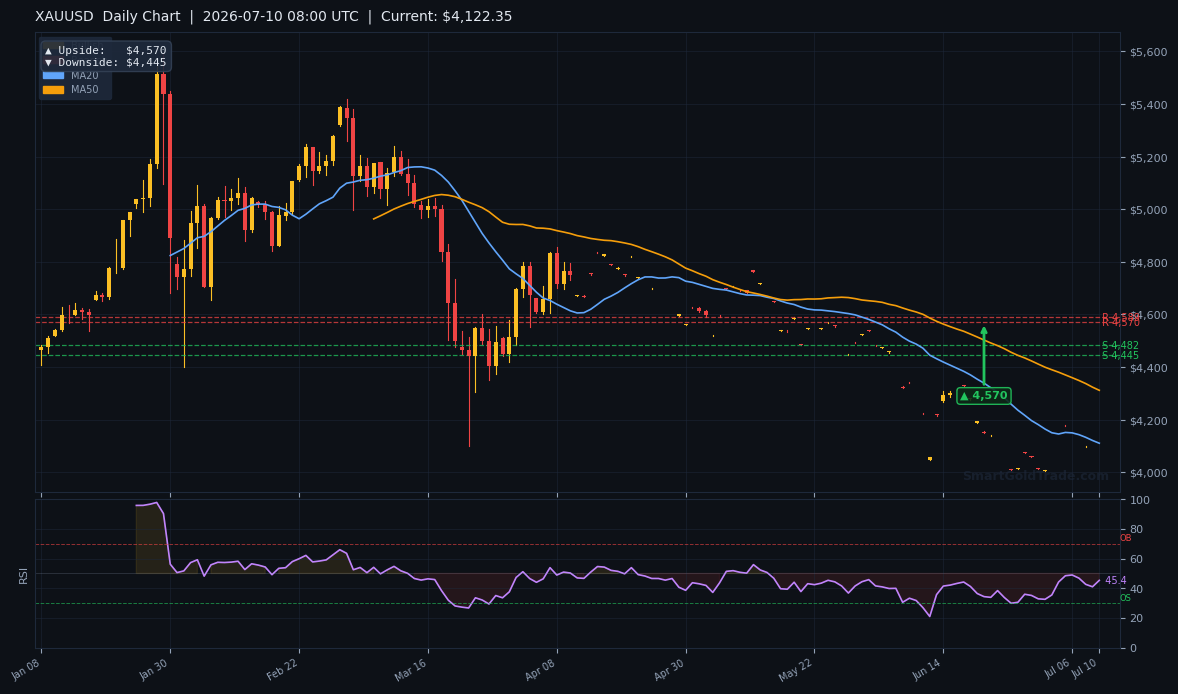
Gold price has vaulted above the $4,110 handle in early European trading on July 10, powered by a fresh wave of Iran-related headlines that returned geopolitical risk premia to the fore. Last week’s softer US labour-market data had already bolstered rate-cut hopes, but this morning’s move is strictly a safe-haven bid. As London desks ramp up and liquidity swells, the metal is challenging a zone where short-term momentum meets a cluster of resistance points, making the next few hours critical for directional conviction.
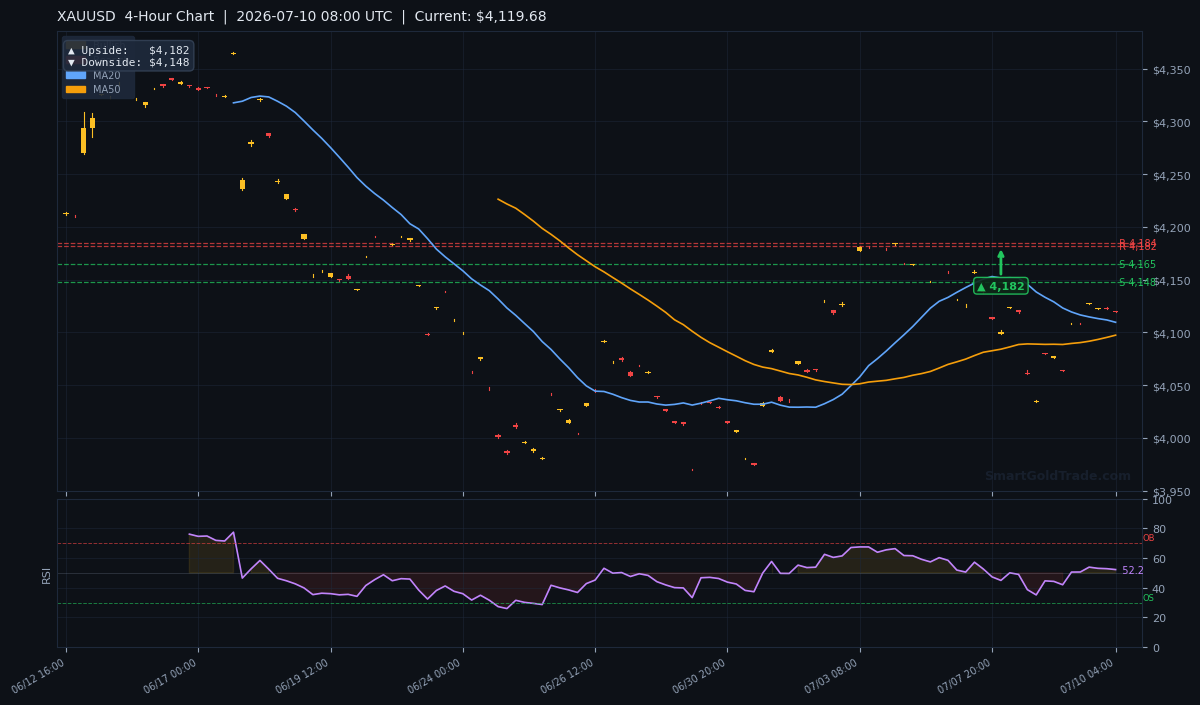
The early spike puts the $4,184 level squarely in the spotlight. If buyers can absorb the opening hour’s volatility and hold gains above the 20-period moving average, the European session could deliver a clean break toward the 4-hour upside objective.
Gold Market Overview
Macro Context
The US Dollar Index is hovering around 105.50, while the 10-year Treasury yield sits near 4.85% — a backdrop that normally caps non-yielding assets. Yet gold price has managed to push above $4,100, suggesting the market is pricing a fresh geopolitical premium rather than a pure dollar move. Commerzbank’s Thu Lan Nguyen noted that EUR/USD has largely ignored Iran headlines and that the traditional oil-correlation has weakened, but gold continues to draw bids when Middle Eastern tensions escalate.
Markets still anticipate at least one Federal Reserve rate cut before year-end, though a hawkish repricing could surface if Friday’s inflation data surprises to the upside. For now, the macro landscape is a tug-of-war between a resilient dollar and rising haven demand, with gold price holding the upper hand early Thursday.
Session Outlook
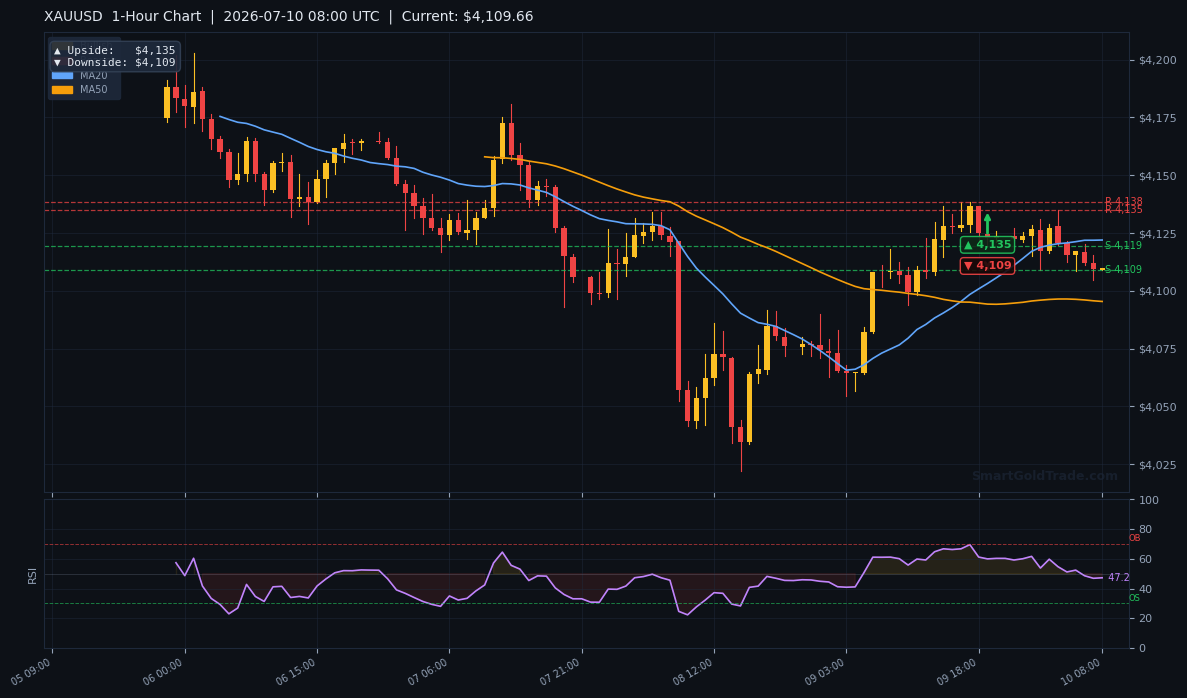
The European morning typically brings a wave of institutional rebalancing and fresh order flow. With no top-tier US economic releases due today, headlines from the Middle East and technical breakouts will drive the tape. A sustained push above the $4,119 area would likely trigger stop-buy orders targeting the $4,181–$4,184 resistance pocket, while a failure at the session open could see the price retreat toward the $4,109 short-term moving average.
Liquidity will be at its richest between 08:00 and 11:00 UTC, so the next three hours are likely to define the day’s range. Traders should watch how gold price behaves around the MA20 and the initial offer at $4,135 — the 1-hour upside target.
Gold Price Technical Analysis
Moving Average Structure
The 20-period moving average at $4,109.55 has crossed above the 50-period MA at $4,097.33, generating a short-term bullish alignment. Price is comfortably above both shorter MAs, with the current quote of $4,119.68 reinforcing the upward tilt. However, the 200-period MA at $4,237.95 still looms far above, keeping the broader picture in bear territory. A golden cross of the MA50 above the MA200 is still weeks away, so the trend remains corrective rather than a confirmed reversal.
This structure tells us that intraday momentum favours buyers, but sellers will reappear with conviction near the $4,237 magnet. For now, the distance between price and the 200-MA leaves plenty of room for a squeeze.
RSI and Momentum
The 14-bar Relative Strength Index reads 52.2, parked squarely in neutral territory. There is no sign of overbought conditions, meaning an extension toward 60–65 is entirely possible if today’s safe-haven bid persists. Conversely, a dip below 50 on the RSI would suggest that the push above $4,110 is running out of steam, turning the intraday bias back to consolidation.
The ATR(14) of $19.29 indicates that average daily travel should fall between roughly $4,100 and $4,139, though breakouts can easily stretch that band. With RSI neutral and ATR elevated, the market is primed for a momentum-driven move out of the opening range.
Key Price Levels
Support sits at S1: $4,164.51, with deeper demand at S2: $4,147.61. Resistance is clustered in a tight band: R2: $4,181.55 and R1: $4,184.32. If price slices through this zone, there is little overhead supply until the daily upside projection at $4,570. On the downside, a break below $4,147.61 would likely expose the 1-hour downside target of $4,109 and the MA20.
The following table summarises the pivot arrows from the three timeframes in play today:
| Timeframe | Upside Target | Downside Target |
|---|---|---|
| Daily | $4,570 | $4,445 |
| 4‑Hour | $4,182 | $4,148 |
| 1‑Hour | $4,135 | $4,109 |
The 4‑hour upside target of $4,182 aligns almost perfectly with the R1/R2 resistance cluster, making it the pivotal level to monitor throughout the European session.
Fundamental Drivers
The headline driver this morning is the escalation of tensions involving Iran, which has sent a pulse of haven flows into gold. Commerzbank’s FX team pointed out that EUR/USD has remained surprisingly calm and that the historical oil‑gold correlation has weakened, but gold price continues to react to Middle Eastern instability. Traders are buying insurance, not commodities, and that dynamic favours the yellow metal.
On the monetary policy front, the Federal Reserve remains data‑dependent. The market has priced in a high probability of a quarter‑point rate cut by September, but that expectation could shift rapidly. The US Dollar Index has not broken meaningfully lower, yet gold price is rising — confirming that geopolitics, not the dollar, is the primary engine today.
Key Event to Watch
The most important scheduled event on the calendar is Friday’s US Consumer Price Index (CPI) for June, due July 12. If inflation decelerates more than expected — especially the core reading — gold price could accelerate well beyond the $4,184 resistance toward the daily upside target of $4,570. Conversely, a sticky CPI print would give the dollar a sharp bid, quickly endangering intraday support at $4,148 and flipping momentum back to bears. Until that data drops, price action will remain headline‑sensitive, with Middle East developments keeping an underlying bid alive.
Devil’s Advocate
The case for bulls crumples if Iran tensions de‑escalate suddenly or if the DXY surges past 106.00. A swift drop below the $4,109 MA20 would be the first warning, and a confirmed close under the S2 support at $4,147.61 would invalidate the immediate bullish setup entirely. In that scenario, the bias flips back to range‑trading, with the 50‑period MA at $4,097.33 becoming the next magnet.
Another risk is a false breakout above the $4,181–$4,184 wall. If price prints a wick and reverses sharply, trapped longs could accelerate a sell‑off back into the $4,148 region. The volume profile at the open will be crucial.
Trading Strategy for European Session
The preferred approach is to buy a shallow pullback into the $4,112–$4,118 zone, which coincides with a retest of the 20‑period MA at $4,109.55. Place a protective stop at $4,105, just beneath the 1‑hour downside target of $4,109. This keeps risk at roughly $14 per ounce.
First take‑profit sits at the 1‑hour upside objective of $4,135. A more ambitious target is the 4‑hour pivot at $4,182, which overlaps the resistance cluster of $4,181.55–$4,184.32.
With an ATR of $19.29, a move to $4,182 represents an approximate $62 gain, yielding a risk‑reward ratio well above 1:3. For traders looking to participate in momentum moves with pinpoint timing, professional gold trading signals can provide real‑time entry and exit alerts throughout the session. And because riba is prohibited in Islamic finance, executing such plans on SmartGoldTrade’s halal gold trading platform keeps your positions spot‑based, swap‑free, and backed by physical ownership.
Aggressive traders may also consider a breakout buy above $4,185 with a tight stop at $4,164 (S1), targeting a quick run to $4,200. However, a failed breakout would call for an immediate short scalp back toward the 20‑MA.
Key Takeaways
- Gold price is trading at $4,119.68, firmly above the 20‑period MA of $4,109.55, confirming short‑term bullish momentum.
- RSI (14) at 52.2 leaves ample room for an upside extension before overbought signals appear.
- The $4,181.55–$4,184.32 resistance band is the must‑hold ceiling for bears; a break above could unlock a move toward the daily target of $4,570.
- Immediate support rests at $4,164.51, with a deeper floor at $4,147.61 — a drop below the latter would flip the intraday bias neutral‑to‑bearish.
- ATR of $19.29 projects a likely session range between $4,100 and $4,139, though geopolitical headlines could widen that band sharply.
- Friday’s CPI report holds the power to either turbocharge the rally toward $4,570 or send gold price reeling below $4,148.
Conclusion
Bullish momentum holds the upper hand during the European morning, anchored by rising Iran tensions and a supportive short‑term moving average structure. As long as gold price respects the $4,109 pivot, a move toward the $4,181–$4,184 resistance zone looks increasingly probable. A clean break above that ceiling would set the stage for a larger rally into the second half of July.
Still, the longer‑term chart remains capped by the $4,237.95 MA200, reminding traders that this is a corrective swing inside a broader bearish framework. For those who prefer tangible exposure alongside their trading positions, you can purchase physical gold coins and bars directly from SmartGoldTrade to complement any tactical plays.
FAQ
- 1. Is gold price bullish or bearish today?
- The intraday bias is decidedly bullish, backed by a moving‑average crossover and fresh safe‑haven flows. However, the bigger picture stays corrective until the price clears the 200‑period MA near $4,237.
- 2. What’s driving gold price right now?
- Iran‑related geopolitical headlines are the primary engine this morning, supported by rate‑cut expectations after last week’s soft US jobs data. The dollar and yields haven’t moved much, confirming the move is a pure risk‑off bid for the yellow metal.
- 3. Can I access halal gold trading on this platform?
- Absolutely. SmartGoldTrade offers Shariah‑compliant spot gold trading with zero overnight interest and full physical backing, letting you act on technical setups without compromising Islamic finance principles.