
Gold price is trading at $4,527.44 during the Asian session on May 22, but a closer look at the technical structure suggests a potential pullback before any continuation higher. This morning's Australian labor data weighed on AUD/JPY, creating a quiet environment for precious metals as traders digest the mixed signals. While the short-term trend shows a small bullish tilt, medium-term moving averages remain bearish, and momentum is neutral. The session ahead may see gold drift lower toward key support before finding fresh buyers.
Gold Market Overview
Macro Context
The US Dollar Index (DXY) continues to hover near the 99 level after last week's slide, providing a tailwind for gold. However, that rally has stalled in overnight trading as Asian liquidity thins. US Treasury yields remain subdued, with the 10-year yield hovering around 3.85%, offering no fresh catalyst for a breakout. Over the past week, gold price moves have closely tracked U.S. real yields and dollar direction; markets have already priced in a June rate cut, which has kept a floor under bids. But without fresh dovish signals and no FOMC speakers on today's calendar, buyers are stepping back. Geopolitical tensions remain elevated in Eastern Europe, though much of the risk premium is already baked in.
Session Outlook
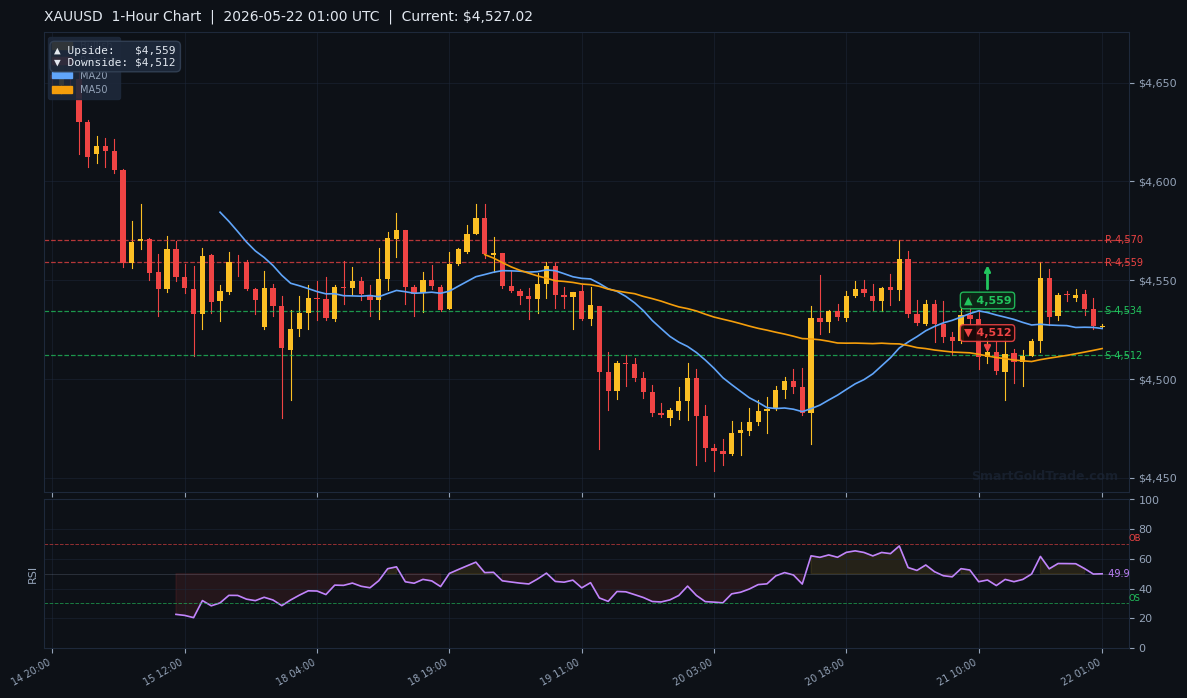
The Asian session typically sees lower volume, and today is no exception. Expect range-bound price action between $4,512 and $4,559 as traders wait for US jobless claims later in the day. Liquidity-driven whipsaws are common in this window, so chasing small breakouts before London opens rarely works. The lack of major data from Asia keeps gold in a consolidation pattern. Patience is key — waiting for a clear test of either boundary will define the next leg.
Technical Analysis
Moving Average Structure
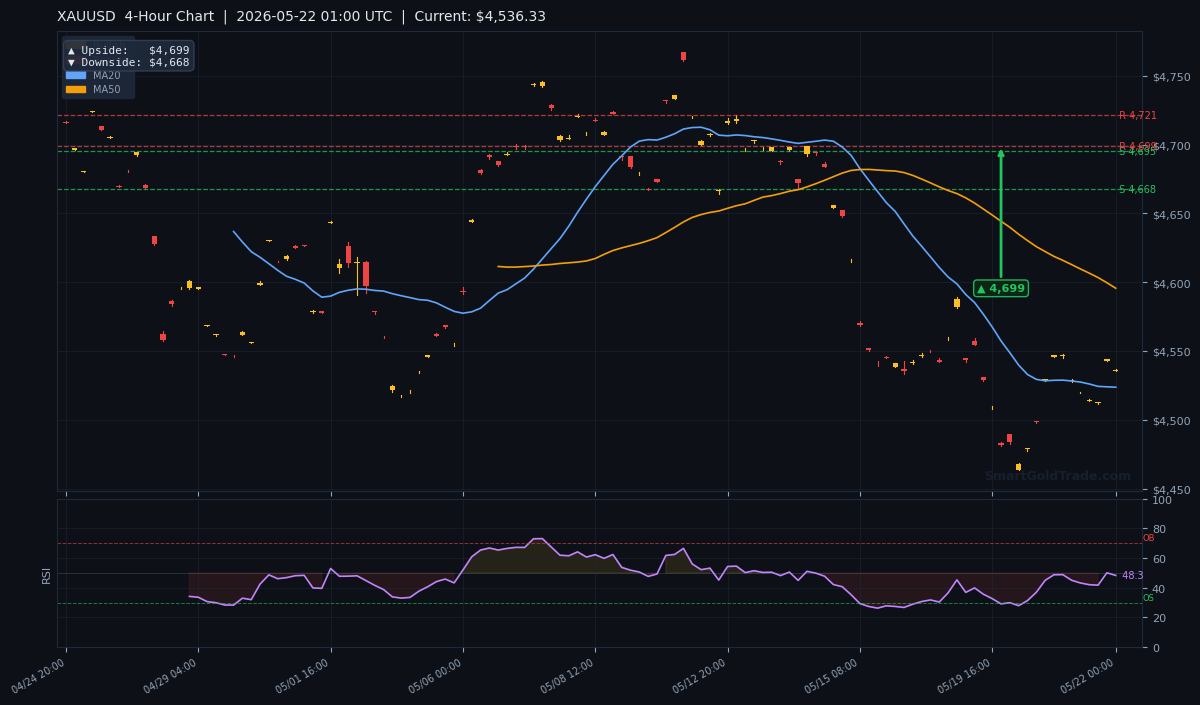
The 20-period MA (MA20) stands at $4,523.68, and price currently sits above it, indicating short-term bullish momentum. However, the 50-period MA (MA50) at $4,595.61 and the 200-period MA (MA200) at $4,679.13 are both above current price. This puts us in a classic bearish alignment — the MA20 holds below the MA50, and the MA50 remains below the MA200 — reinforcing the overall downtrend on the H4 chart. Any rally toward the MA50 will face strong overhead resistance, and until the MA20 reclaims that level, the path of least resistance is still lower.
RSI and Momentum
The Relative Strength Index (RSI, 14) reads 48.3 — perfectly neutral. Neither overbought nor oversold, giving traders no extreme signal to act on. This supports the view that gold is in a waiting game. The Average True Range (ATR) is $15.60, meaning even a modest move of $15–$16 from current levels falls within normal daily volatility. Momentum oscillators lean slightly to the downside, failing to confirm the minor price recovery above the MA20, so upside follow-through looks limited.
Pivot Levels and Key Price Zones
Classic floor pivot points derived from the previous session's high, low, and close map out the intraday battleground. On the 1-hour chart, the immediate resistance sits at $4,559 and support at $4,512 — these are the levels to watch during the Asian window. Stepping out to the 4-hour timeframe, the upside target extends to $4,699 and downside to $4,668. The daily pivots point to $4,838 on the upside and $4,667 on the downside. These zones will likely cap any breakout attempt before meaningful momentum arrives.
| Timeframe | Upside Target | Downside Target |
|---|---|---|
| 1-Hour | $4,559 | $4,512 |
| 4-Hour | $4,699 | $4,668 |
| Daily | $4,838 | $4,667 |
Fundamental Drivers
The only notable data from today's session is Australia's labor market figures, which came in softer than expected, casting a shadow over risk-sensitive currencies like AUD and JPY. This had a minor spillover to gold via a slightly softer DXY, but the impact was muted. The dominant driver remains the US dollar weakness from last week, though that momentum is fading. The Fed's next move is still the primary long-term driver; markets are pricing a 25-basis-point cut in June with a high degree of confidence, but no new commentary today leaves gold price direction tied to incoming data.
Key Event to Watch
Later today, the US initial jobless claims report will provide a fresh check on labor market health. A stronger number could revive the dollar and pressure gold down toward $4,512. Conversely, a weak reading might push gold toward $4,559. Given the thin Asian liquidity, the full reaction will likely only materialize once London steps in, so Asian-session breakouts ahead of the news should be taken with a grain of salt.
Devil's Advocate
What if gold breaks above $4,559? That would invalidate the bearish bias and open the door to a retest of the MA50 at $4,595. In that scenario, the pullback thesis fails, and bulls could target the 4-hour resistance at $4,699. A break above $4,559 on high volume would signal renewed buying interest — possibly driven by a sharp fall in real yields or a geopolitical shock. For now, however, the path of least resistance remains lower, and the burden of proof lies with the bulls.
Trading Strategy for Asian Session
Given the neutral RSI and bearish MA structure, a short bias is preferred but only with a tight stop. The optimal entry zone is near the current price of $4,527 to $4,530, targeting the 1-hour downside pivot at $4,512. Place a stop loss above the 1-hour resistance at $4,565 (just above $4,559 to avoid noise). That gives a risk of about $35 and a reward of $15–$18, which is below a 1:1 ratio, so position size should be small.
Alternatively, aggressive traders can wait for a bounce from $4,512 to go long with a stop below $4,496 (ATR-based) and target $4,559. The risk-reward on that is roughly 1:2.7, making it more attractive if support holds. For those who want to execute these trades on a Shariah-compliant foundation, SmartGoldTrade's halal gold trading platform offers spot-only, interest-free execution — so you can act on setups like this without compromising your principles. If you're relying on structured alerts, professional gold trading signals can help identify high-probability entries during low-volume sessions like this one.
Key Takeaways
- Gold price at $4,527.44 is above MA20 but below MA50 and MA200, indicating conflicting trends.
- RSI at 48.3 signals neutral momentum — no extreme oversold or overbought conditions.
- 1-hour upside target: $4,559; downside target: $4,512.
- ATR of $15.60 suggests a modest move of $15–$16 is normal for the session.
- A break below $4,512 could accelerate losses toward $4,467 (daily support).
- If $4,559 is breached, the bias flips bullish toward $4,595.
Conclusion
The gold price setup for the Asian session favors a cautious pullback scenario. While the short-term trend shows a slight bullish tilt, the larger picture is still bearish with price below both the MA50 and MA200. The neutral RSI gives no reason to chase the upside. Focus on the $4,512–$4,559 range and wait for a clear breakout or breakdown before committing. For those who prefer to hold physical metal as a long-term inflation hedge, you can purchase physical gold from SmartGoldTrade's certified store. The next move will likely come with the US jobless claims release — until then, patience is the best strategy.
FAQ
- What is the current gold price in the Asian session?
- Gold (XAU/USD) is trading at $4,527.44 as of 01:00 UTC on May 22, 2026, during the Asian session.
- Why is gold price expected to pull back?
- The price sits below the MA50 ($4,595.61) and MA200 ($4,679.13), with RSI neutral at 48.3. The bearish moving-average alignment and thin liquidity suggest a retest of immediate support at $4,512 is likely before buyers step in.
- What fundamental event could move gold today?
- US initial jobless claims later in the day are the primary risk event. A strong reading could boost the dollar and push gold lower, while a weak one may drive a bounce toward $4,559.
Risk Disclaimer: Trading Gold (XAU/USD) carries significant risk of loss and is not suitable for all investors. This content is for informational purposes only and does not constitute financial advice. Always conduct your own research and trade responsibly.