Gold price is trading at $4,067.37 during Sunday’s Asian session, slipping further below the 20-period and 50-period moving averages. Thin liquidity and cautious positioning ahead of Monday’s high-impact US CPI data kept the metal under modest selling pressure. Last week’s break of the $4,100 handle confirmed a lower-low structure on the 4-hour chart, shifting near-term control to sellers. Traders are now watching whether the key $4,067 level—the overnight spot low and a psychological round number—can hold. While the quiet Sunday session invites patience, any unexpected flicker of demand or macro headline could trigger outsized moves in a market starved for volume.
Gold Market Overview
Macro Context
The US Dollar Index is holding firm near 105.50, buoyed by expectations that Fed Chair Warsh will maintain a cautious tone in tomorrow’s testimony. The 10-year Treasury yield remains elevated around 4.20%, pressuring non-yielding assets like gold. Geopolitical risks have eased slightly after last week’s Iran headlines faded, removing one source of safe-haven bids. The overall macro backdrop leans dollar-supportive, which historically weighs on gold price. However, the market is on hold until Monday’s inflation data, leaving the Asian session without a clear fundamental catalyst.
Session Outlook
Asian trading on Sunday is typically the quietest of the week, and with Monday’s US CPI and Fed testimony looming, participation will be extremely thin. Liquidity gaps often produce erratic spikes, so traders should avoid chasing breakouts. The likely intraday range sits between $4,067 and $4,100, with a bias towards fading rallies unless fresh headlines emerge. Any sharp move beyond these boundaries risks being a false break, so confirmation on higher timeframes is essential before committing capital.
Market Sentiment
The broader gold price narrative still leans on structural demand from central banks and persistent geopolitical undercurrents, but short-term momentum clearly favours bears. Last week’s CFTC positioning data showed a notable drop in net speculative long positions, reflecting reduced conviction among large traders. While retail sentiment remains modestly bullish, the contrast with institutional selling highlights the risk of further downside if key economic data surprises to the upside. For the Asian session, this divergence reinforces the importance of sticking to a level-by-level approach rather than reacting to fleeting price moves.
Gold Price Technical Analysis
Moving Average Structure
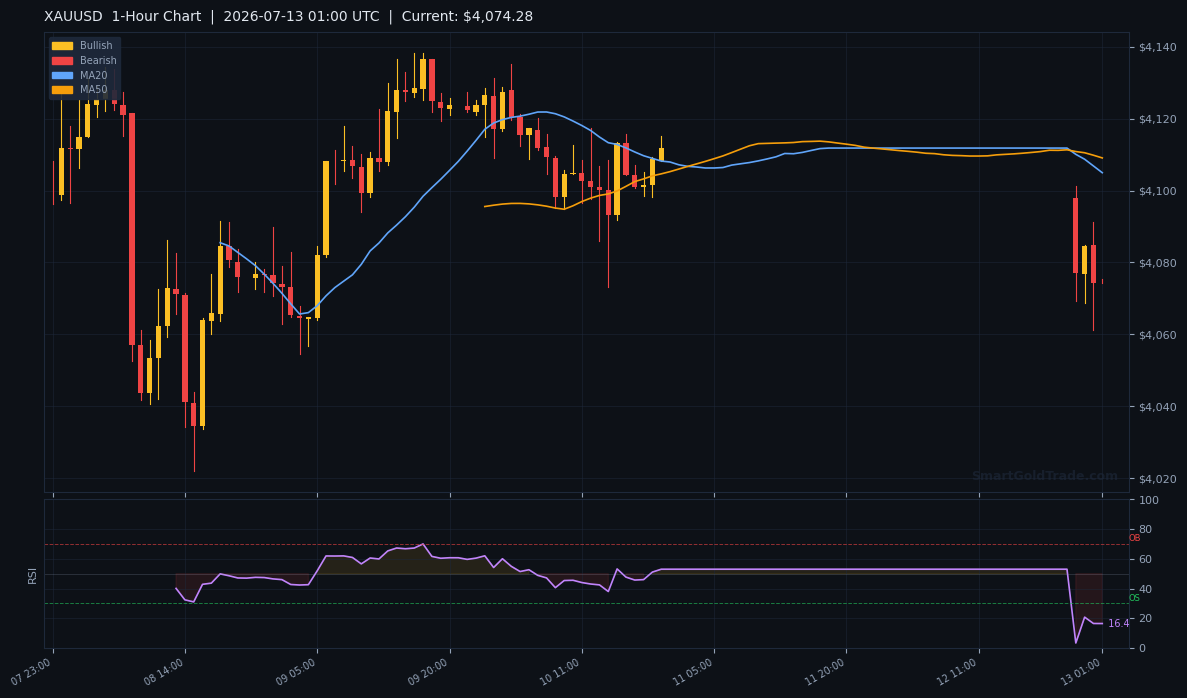
The 20-period moving average sits at $4,099.07 and the 50-period at $4,107.75—both far above spot. The long‑term 200-period MA at $4,226.29 reinforces the bearish picture. The short‑term MA20 < MA50 alignment confirms active selling pressure. With gold price trading at $4,067.37, well below all three averages, the path of least resistance is lower until a daily close above $4,100 destabilises the shorts.
RSI and Momentum
The 14‑period RSI reads 43.4, well into neutral territory but below the 50 midline. This signals weak momentum without reaching oversold extremes, leaving room for further declines before bargain hunters step in. For intraday entries, the RSI structure favours selling into bounces rather than chasing breakdowns.
Key Price Levels
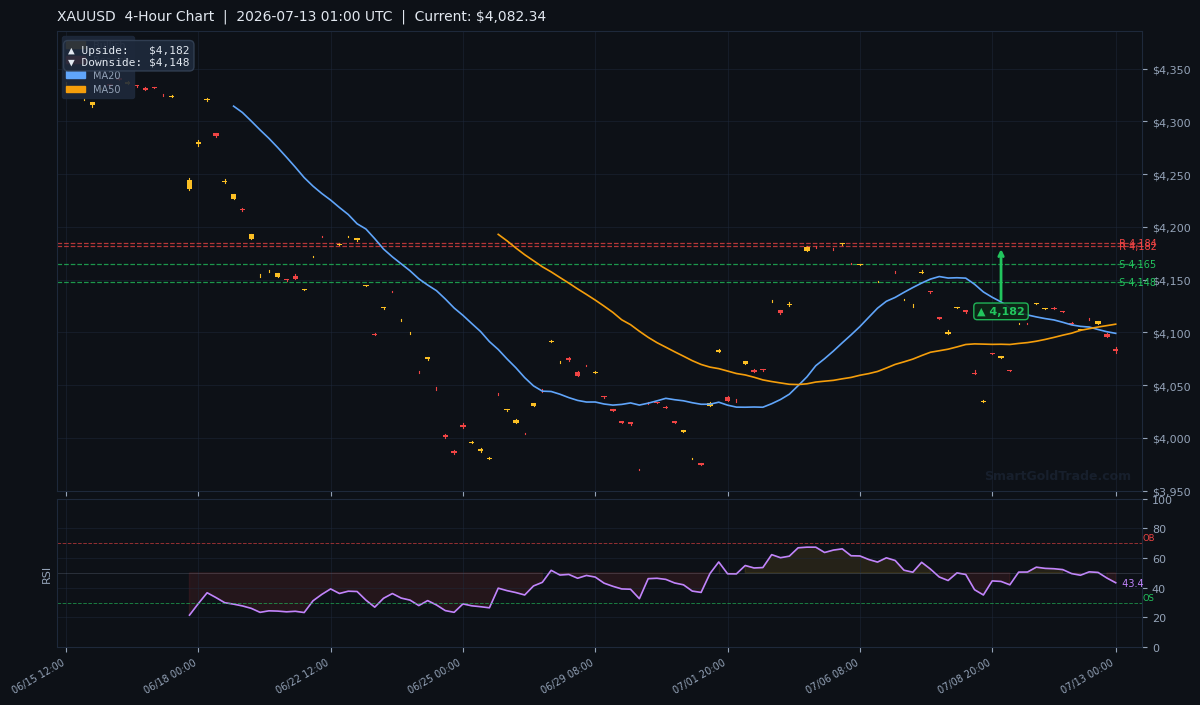
With spot below the pivot, the closest measured levels from the indicator suite are S1 at $4,164.51 and S2 at $4,147.61, both acting as overhead resistance. Immediate support now stands at the session low of $4,067. A break there opens $4,060. The ATR(14) of $11.29 frames the expected daily range around $4,067 ± $11. The resistance cluster at R1 $4,184.32 and R2 $4,181.55 is far away but forms a cap for any sharp squeeze higher.
| Timeframe | Resistance | Support | Bias |
|---|---|---|---|
| 1‑Hour | $4,100 (MA20) | $4,067 (overnight low) | Bearish |
| 4‑Hour | $4,182 / $4,148 | $4,148 (S2) / $4,067 | Bearish |
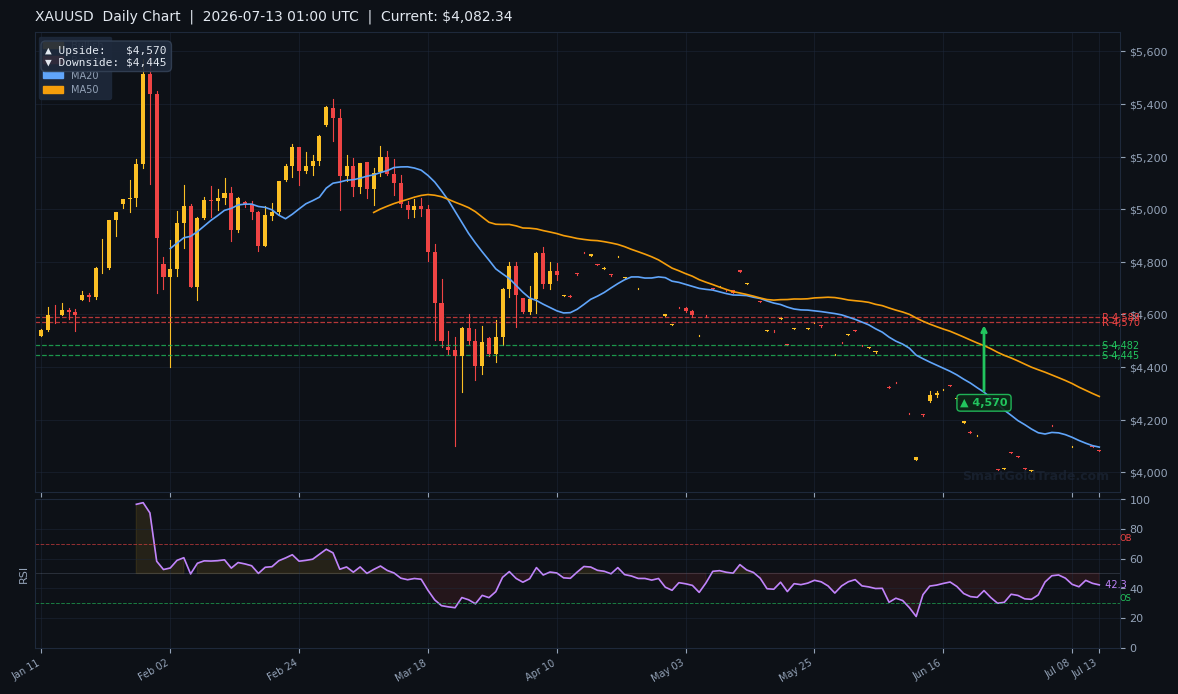
| Daily | $4,570 | $4,445 | Long‑term caution |
Gold Price Fundamental Drivers
Monday’s US economic calendar is loaded with high‑impact events. The Core CPI y/y is forecast at 2.8% (previous 2.9%), while the headline CPI y/y is expected to fall to 3.8% from 4.2%. If realised, the sharp disinflation could revive bets on a less‑hawkish Fed and lift gold price. Conversely, any upside surprise would reinforce the dollar and push XAU/USD below $4,067. Right now, the CME FedWatch Tool indicates a 75% chance the Fed holds rates steady in September, so any data that shifts this probability will dramatically affect the gold price. Fed Chair Warsh’s testimony later in the day adds another layer: remarks hinting at patience on rates could cap the dollar, while hawkish leanings would amplify gold’s downside. For now, the Asian session lacks a direct catalyst, but positioning ahead of these events keeps the metal heavy.
Key Event to Watch
The single most important release this week is the US CPI print on Monday. A below‑consensus number, especially on the core measure, would likely trigger a short‑squeeze in gold, propelling price towards the $4,100–$4,148 resistance zone. A sticky or higher reading would validate the current bearish structure, with $4,060 and potentially the $4,445 daily target coming into play. Traders should prepare for elevated volatility as soon as European markets open after the CPI release.
Devil's Advocate
The bearish bias collapses if gold price reclaims $4,100 on a 4‑hour closing basis. A sustained move above the MA20 at $4,099.07 would likely trigger stops, dragging the metal toward the S2 resistance at $4,147.61. Geopolitical headlines—such as a sudden escalation in the Middle East—could spark a safe‑haven bid that ignores technicals entirely. Additionally, if the Asian session sees a liquidity‑driven spike through $4,100 without bearish rejection, the bear thesis must be shelved until after the CPI data. Algorithmic trend-followers often pile in once the $4,100 barrier is cleared, and with liquidity thin, a rapid run to $4,148 is entirely possible.
Trading Strategy for Asian Session
Thin Sunday liquidity demands a measured approach. The preferred tactic is to wait for a bounce into the $4,098–$4,100 resistance zone, near the 20‑period MA, and initiate shorts on a bearish rejection candle. A stop loss placed at $4,105—roughly half the ATR above the level—provides a defined risk. The initial take‑profit target is $4,067, with a trailing stop or final objective at $4,060. This gives a risk‑reward ratio of approximately 1:2.
For aggressive traders, a confirmed break below $4,067 could be sold with a stop above $4,074 and the same downside targets. However, with CPI just hours away, many professionals will stay flat until the Monday US session. Using a halal gold trading platform ensures spot ownership and zero overnight swaps, aligning with the cautious, low‑leverage mindset appropriate for this environment. Those seeking additional confirmation can blend this setup with professional gold trading signals that issue precise entry and exit alerts. For a completely hands-off approach, copy trading mirrors skilled Islamic gold traders, letting you earn passively while staying Shariah-compliant.
Key Takeaways
- Gold price trades at $4,067.37, well below the 20‑period MA at $4,099.07, keeping the short‑term bias bearish.
- RSI at 43.4 signals momentum weakness but no oversold condition, allowing further downside.
- Immediate support rests at $4,067; a breakdown targets $4,060 and eventually the daily pivot at $4,445.
- Resistance cluster at $4,100 (MA20) and $4,148 (S2) must be cleared to challenge the bearish structure.
- Monday’s US CPI and Fed Chair Warsh testimony are the week’s pivotal events, capable of expanding the daily range well beyond the ATR of $11.29.
- Asian session liquidity is razor‑thin; avoid chasing moves and wait for clear rejection or breakout signals on higher timeframes.
Conclusion
The Sunday Asian session leaves gold price pinned between $4,067 support and $4,100 resistance, with all moving averages pointing lower. Tomorrow’s US inflation data will decide whether the metal stages a tactical squeeze or extends its decline toward $4,060. Until then, patience is the most profitable strategy. Use the quiet hours to mark key levels, set alerts, and prepare for the volatility that will arrive with the European open. Whether you’re an active trader or prefer passive strategies, tools like halal spot trading, copy trading, and professional signals provide a full Shariah-compliant toolkit for navigating gold price volatility.
FAQ
- What is the gold price right now?
- Gold price is trading at $4,067.37 during Sunday’s Asian session, slightly below Friday’s close of around $4,090.
- What are the key support and resistance levels for XAUUSD today?
- Immediate support is at $4,067, with a break exposing $4,060. Resistance stands at $4,100 (20‑period MA) and the $4,148 S2 level.
- Why is the Asian session so quiet?
- Major financial centres in Tokyo, Singapore, and Sydney are off or in low‑participation mode, and traders are waiting for Monday’s high‑impact US CPI data before committing capital.
- What should I do if gold price breaks below $4,067?
- A confirmed 1‑hour close below $4,067 would open the door to $4,060 and potentially the $4,445 daily target. Risk‑conscious traders should use tight stops and consider waiting for a retest before entering.
- How can I track gold price effectively during low liquidity?
- Use price alerts at key levels like $4,067 and $4,100, and monitor 1-hour candle closes to avoid false breaks. Many traders also rely on a halal gold trading platform with real-time charts and Islamic-compliant tools.
Risk Disclaimer: Trading Gold (XAU/USD) carries significant risk of loss and is not suitable for all investors. This content is for informational purposes only and does not constitute financial advice. Always conduct your own research and trade responsibly.