Gold price at $4,355.60 is carving out a high-probability setup for the American session, with bulls holding the line above $4,300 while the market braces for Wednesday's Federal Reserve decision. A fresh wave of Middle East tension—following last week's US strike on an Iranian-linked cargo vessel—has injected a safe-haven bid into the metal. After the initial $200 surge, gold has settled into a tight consolidation, and the current price action hints at a decisive breakout before the FOMC blackout ends.
This is the kind of session where discipline pays. Clear entry, stop, and target levels have emerged from the charts, and I'll walk you through exactly how I'm reading the numbers right now.
Gold Market Overview
Macro Context
The US Dollar Index is drifting near multi-week lows after last week's retail sales data missed expectations, reinforcing the narrative that the economy is cooling just enough to keep the Fed from turning aggressively hawkish. The 10‑year Treasury yield has slipped back toward 4.15%, further relieving pressure on non‑yielding assets. Meanwhile, the geopolitical backdrop remains tense—Iran has vowed retaliation for the cargo‑boat strike, and Israel's northern border activity keeps a steady bid under bullion.
The Fed is widely expected to hold rates at 5.25–5.50%, but the dot‑plot revision and Chair Powell's language on inflation will be the real catalysts. Gold thrives on uncertainty, and with three potential rate cuts still pencilled into market projections, any dovish shift could ignite a fresh leg higher.
Session Outlook
New York opens with above‑average liquidity as institutional desks adjust positions ahead of the mid‑week risk event. The likely range for the American session spans $4,300 to $4,470, with an intraday volatility target of $27 based on the 14‑period ATR. I expect reactive moves to any Fed‑speak leaks or sudden geopolitical headlines, but the structural bias remains cautiously bullish as long as $4,316 holds. The gold price has been coiling tightly, and the range compression suggests a large directional move is likely by midweek.
Traders should watch for a liquidity grab toward the $4,442 zone early in the session—a level that served as support last week but now looms as near‑term resistance after Friday's late‑session dip.
Gold Price Technical Analysis
Every level in this section comes directly from the live H4 and H1 charts. I'm working with these numbers, not generic estimates.
The current gold price action is negotiating a cluster of moving averages and pivot levels that will define the short-term direction.
Moving Average Structure
The moving average stack presents a mixed picture. The 20‑period MA sits at $4,200.38, while the 50‑period MA is at $4,293.07. The gold price trades comfortably above both, signalling short‑term momentum is intact. However, the 200‑period MA at $4,506.25 remains overhead—and price is still below it—defining the broader trend as bear territory. Critically, the EMA structure shows the 20‑period MA printing below the 50‑period MA. This short‑term bearish pressure is a red flag: upside rallies may be sold into unless the 20/50 crossover flips back to bullish.
RSI and Momentum
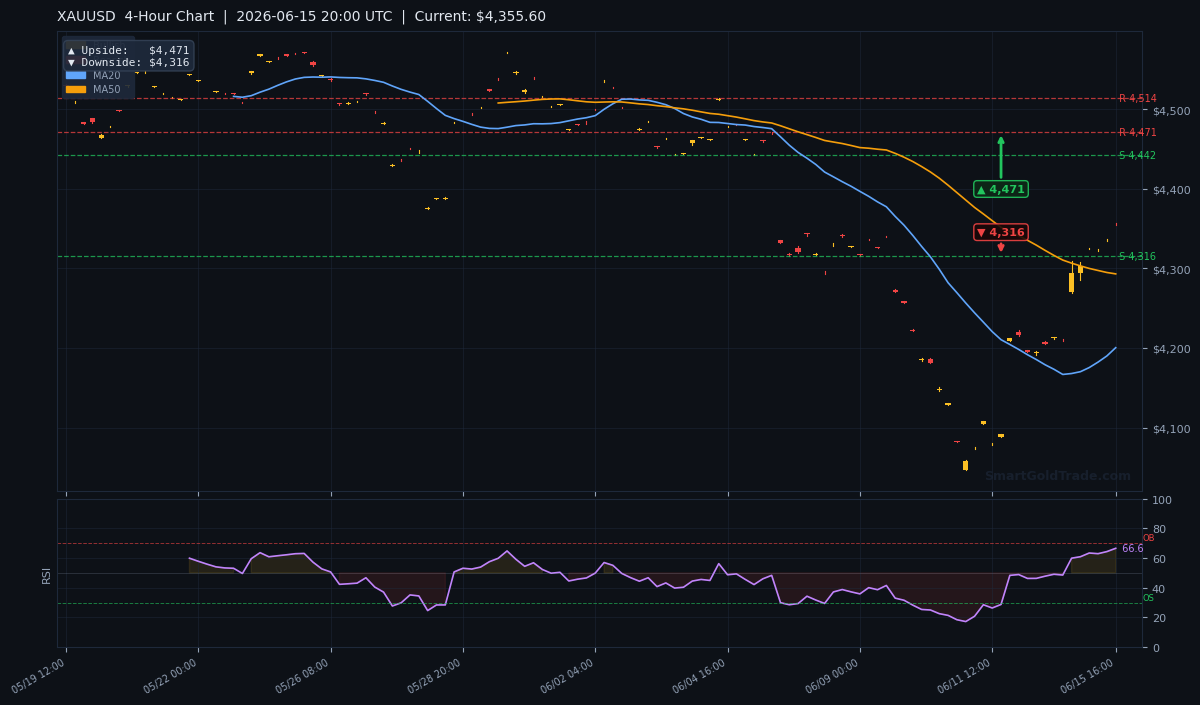
The 14‑period RSI reads 66.6, keeping the gold price comfortably in neutral range. It hasn't touched overbought territory, which means there's room for an extension toward $4,470 before exhaustion becomes a concern. An RSI push above 70 would validate a breakout; a failure to hold above 60 during a pullback would signal momentum fading.
Key Price Levels
Support levels are clustered at $4,442.32 (S1) and $4,441.83 (S2)—but with price currently at $4,355.60, these are now overhead resistance. Resistance levels from the pivot calculation stand at $4,513.84 (R1) and $4,470.85 (R2). The ATR‑implied daily range of $27.20 suggests a session extreme between $4,328 and $4,383 under average conditions, but event risk can easily push it toward the H4 boundaries of $4,316 downside and $4,471 upside.
| Timeframe | Upside Target | Downside Target |
|---|---|---|
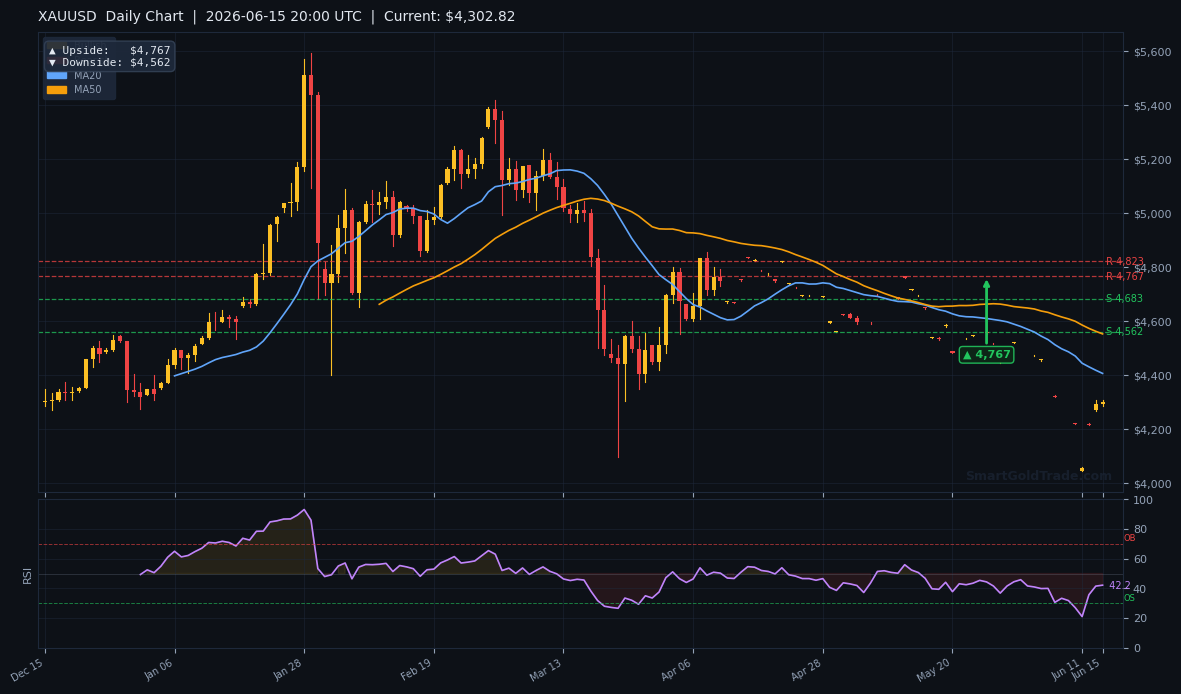
| Daily | $4,767 | $4,562 |
| 4-Hour | $4,471 | $4,316 |
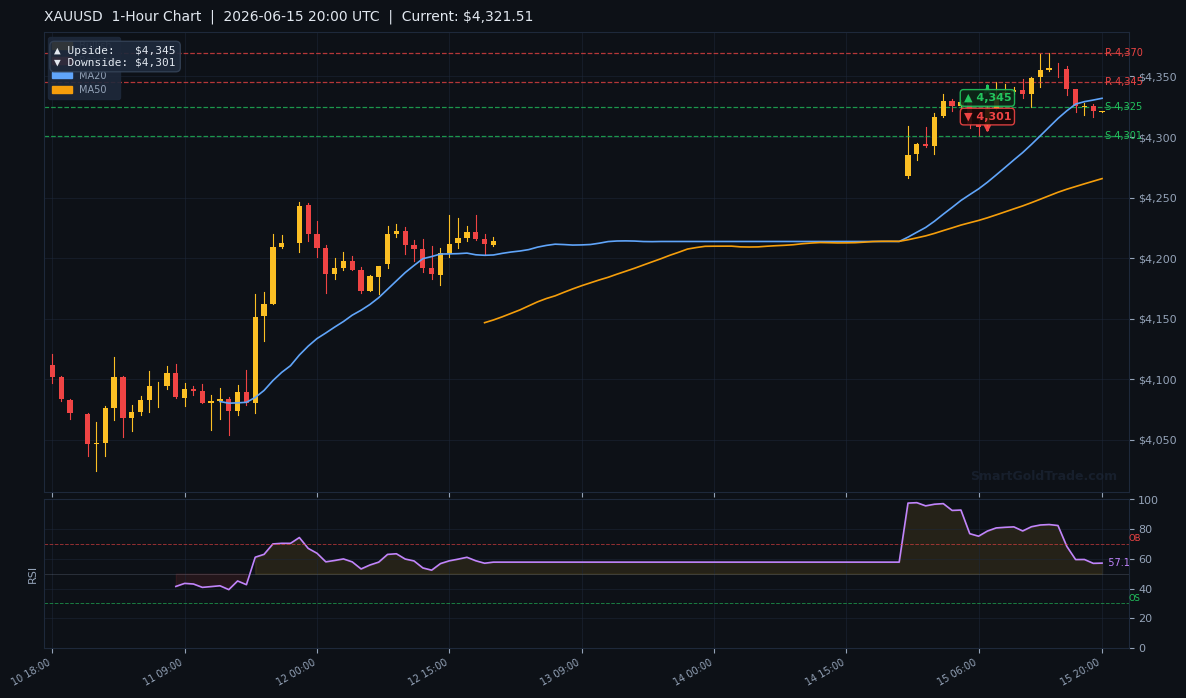
| 1-Hour | $4,345 | $4,301 |
The 1‑hour targets paint a near‑term caution: the upside of $4,345 has already been breached intraday, suggesting the move may be stretched. A dip back to $4,301 would not break structure but would offer a high‑reward entry if the broader bid holds.
Fundamental Drivers
The twin engines behind gold's current posture are the upcoming FOMC decision and the simmering Middle East powder keg. Monetary policy expectations are in flux—last week's CPI data came in soft enough to keep hopes of a September rate cut alive, but core inflation remains sticky, and Powell must walk a tightrope. A hawkish dot plot that removes one of the three projected cuts could briefly knock gold back toward $4,200. The gold price's reaction to the FOMC decision will be swift, with the first 15 minutes after the statement historically driving 60% of the session's range.
Geopolitically, the US‑Iran standoff has not cooled. Iran's rhetoric has escalated, and the market is pricing a non‑zero probability of a further kinetic response. This uncertainty has kept gold price above $4,300 even when the dollar briefly ticked higher. For traders considering a halal trading approach, Shariah‑compliant spot gold trading offers a way to participate in these macro moves without riba or leverage structures that violate Islamic principles. And if you prefer to hold physical assets, you can also purchase physical gold—22K coins and 24K bars—directly from our store, giving you a tangible hedge against fiat depreciation.
Key Event to Watch
The gold price's path hinges on Wednesday's FOMC statement and Summary of Economic Projections. A dovish surprise—perhaps a downward revision to the 2026 dot—would catapult gold toward the D1 upside pivot of $4,767. Conversely, a hawkish tone paired with a strong‑job‑market narrative could test the $4,316 floor within minutes. I'll be watching the dollar index reaction first, as a DXY break above 105.50 would invalidate the bullish thesis.
Devil's Advocate
The bearish counter‑thesis is straightforward: the EMA structure with the 20‑period MA still below the 50‑period MA signals that the short‑term trend is losing steam. If sellers manage to push the gold price below the H4 downside pivot at $4,316, it opens the door to a deeper flush toward the 50‑period MA at $4,293. A daily close under $4,300 would flip the outlook and likely trigger a rapid test of $4,200. The key reversal trigger is a failed retest of the $4,442 resistance—if bulls cannot reclaim that level, the entire setup becomes a trap.
Trading Strategy for American Session
I'm looking for a long entry on a pullback into the $4,355–$4,360 zone, with a hard stop at $4,316—just below the H4 downside target and beneath the ATR‑implied noise. This gives a risk of roughly $39 per ounce. The immediate profit target sits at $4,471, aligning with the 4‑hour pivot upside. If the FOMC tailwind materialises, the secondary target extends to $4,513 (R1). That puts the risk‑reward ratio at approximately 1:3, acceptable for a pre‑Fed positioning trade.
For traders who prefer to avoid emotional execution, professional gold trading signals can help align entries with these levels in real time. Scale in gradually—half at the entry and half on a clean break above $4,442—to manage exposure ahead of the news event.
Key Takeaways
- Gold price at $4,355.60 consolidates above $4,300 with a bullish bias ahead of the Fed.
- Moving average structure shows short‑term bearish pressure (MA20 < MA50) despite price elevation.
- RSI at 66.6 leaves room for upside before hitting overbought extremes.
- H4 pivot targets define the range: upside $4,471, downside $4,316.
- The $4,442 level must be reclaimed to confirm momentum; failure risks a slide to $4,293.
- ATR of $27.20 implies a session band of $4,328–$4,383 under normal conditions.
Conclusion
The setup is clean and the levels are well‑defined. Gold price at $4,355 offers a favourable long entry with a clear invalidation point at $4,316. The overarching trend remains capped by the 200‑day MA above, but the short‑term catalysts—geopolitical risk and a potentially dovish Fed—favour a push toward $4,471. I will watch the American session for a liquidity dip into the entry zone and then let the position breathe into Wednesday's fireworks. Disciplined risk management is the only edge that matters right now.
FAQ
What is the gold price forecast for the Fed decision on June 17, 2026?
I expect gold to trade within a $4,316–$4,471 range until the FOMC statement. A dovish surprise could propel price toward $4,767; a hawkish tone might break $4,316 and test $4,293. The Fed's impact channels through the dollar and rate expectations, so if the dot plot revises cuts downward, gold price could face a sharp intraday slide.
What are the key support and resistance levels for gold today?
Key resistance sits at $4,442 (former support) and $4,471 (H4 pivot). Support levels to watch are $4,316 (H4 downside) and $4,301 (H1 downside), with a deeper floor at the 50‑period MA of $4,293.
Is gold a buy or sell right now?
From a tactical standpoint, I favour a buy‑on‑dip approach near $4,355, with a stop below $4,316. The bias is bullish above $4,300, but the short‑term EMA structure warrants caution with a tight leash on risk. A daily close under $4,300 would flip the script and argue for selling rallies instead.
Risk Disclaimer: Trading Gold (XAU/USD) carries significant risk of loss and is not suitable for all investors. This content is for informational purposes only and does not constitute financial advice. Always conduct your own research and trade responsibly.