Update: The gold price staged a rapid comeback on June 15, erasing early Asian losses and catapulting back above $4,300. After a brief plunge to $4,190—right at the session low—bulls stepped in with force, lifting XAU/USD to $4,328.20 as of 02:30 UTC. The move not only reclaimed the psychological $4,200 barrier but also pushed price back above the pivotal 50-period moving average, flipping the short-term tone from breakdown to breakout in a matter of hours. With the Fed’s two-day meeting starting Tuesday, this rally may just be getting warmed up.
Gold Price Market Overview
Macro Context
The U.S. Dollar Index held firm above 105.50 last week while Treasury yields stayed north of 4.5%, keeping persistent headwinds on non-yielding gold. However, the Asian session’s whipsaw showed that the dollar bid is far from linear—safe-haven flows into gold returned once XAU/USD reached deeply oversold territory. The Federal Reserve’s June decision on the 17th is almost universally priced for a hold at 5.75%, but any shift in the dot-plot projections for late-2026 cuts could be a game-changer. Lingering geopolitical friction—especially fresh U.S.-Iran tensions near the Strait of Hormuz—continues to provide a bullish undercurrent that limits how deep any correction can run.
Session Outlook
Asian liquidity often produces false breaks and exaggerated swings, and today’s price action was a textbook example. The initial sell-off below $4,200 triggered stop-hunting before bargain hunters swept in, creating a V-shaped recovery that left many short-sellers trapped. Thin volumes during the Tokyo and Singapore opens amplify such moves, so traders should remain cautious about chasing the rally. Now that the gold price has reclaimed $4,280–$4,300, a period of consolidation is likely before the next leg—giving latecomers a chance to position on a pullback.
Technical Analysis
Moving Average Structure
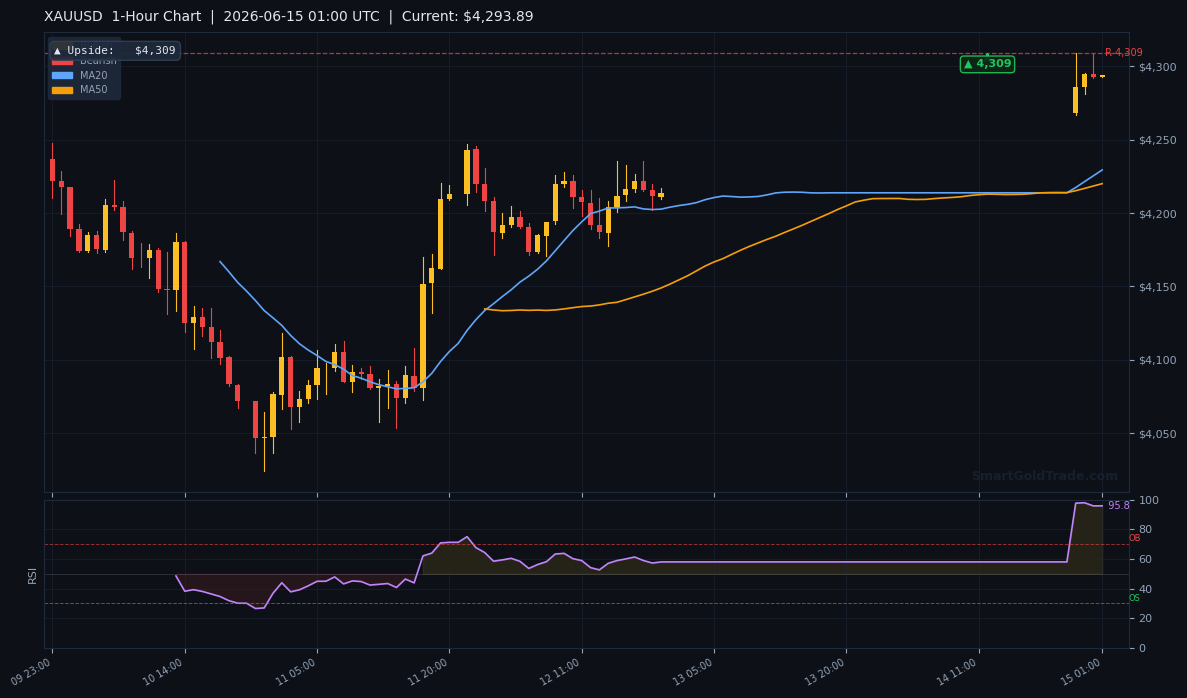
The short-term moving average setup has flipped positively in the wake of the bounce. The 20-period MA at $4,166.75 now sits firmly below the spot gold price, confirming that the recovery has legs. Even more significant, XAU/USD has vaulted back above the 50-period MA at $4,310.42—a level that had acted as rigid resistance during the overnight decline. The 200-period MA remains far overhead at $4,513.79, keeping the broader trend biased lower, but the intraday picture now favours bulls as long as the gold price holds above the MA50. A confirmed close above $4,310 would turn the 50-MA into dynamic support and open a path toward the higher resistance cluster.
RSI and Momentum
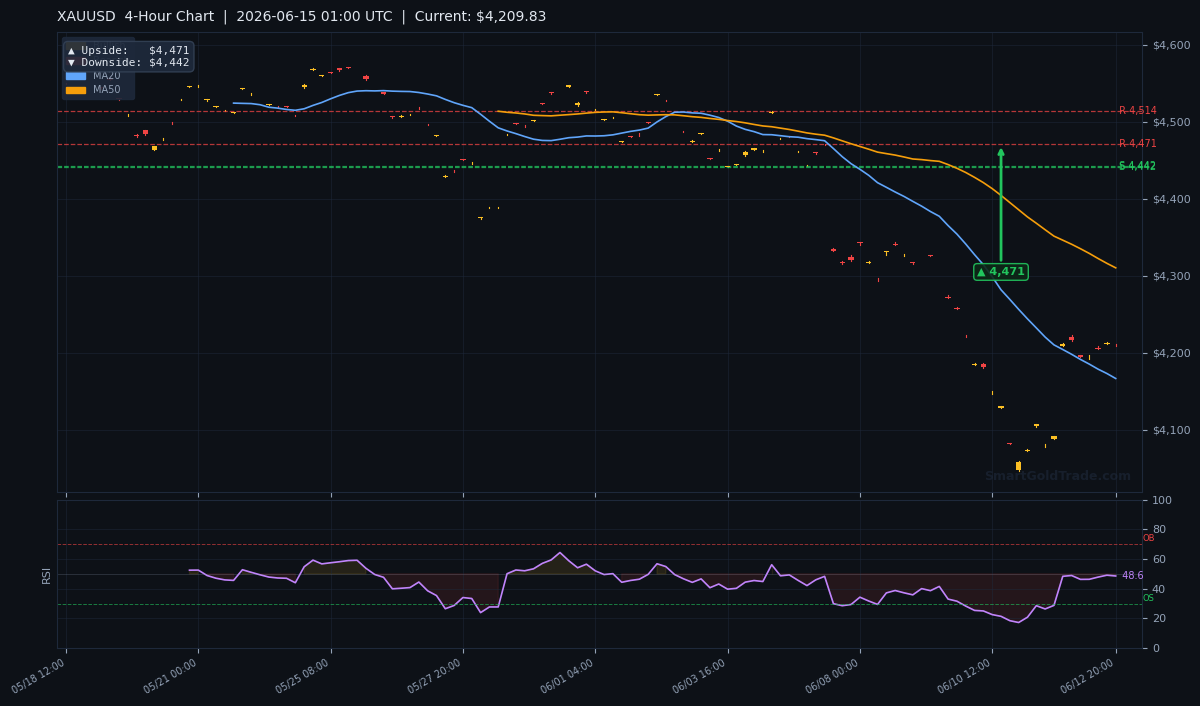
The 14-period RSI on the H4 chart has surged to 55 after spending most of the Asian session in neutral territory near 48. This quick shift into bullish momentum territory is being driven by genuine buying volume, not just a mechanical snapback from oversold extremes. A reading above 55 typically signals that momentum is gaining traction, supporting the case for a continued push toward $4,442. Traders should watch for any RSI dip back below 50 as an early warning that the bounce is stalling—but for now, momentum is on the side of the bulls.
Key Price Levels
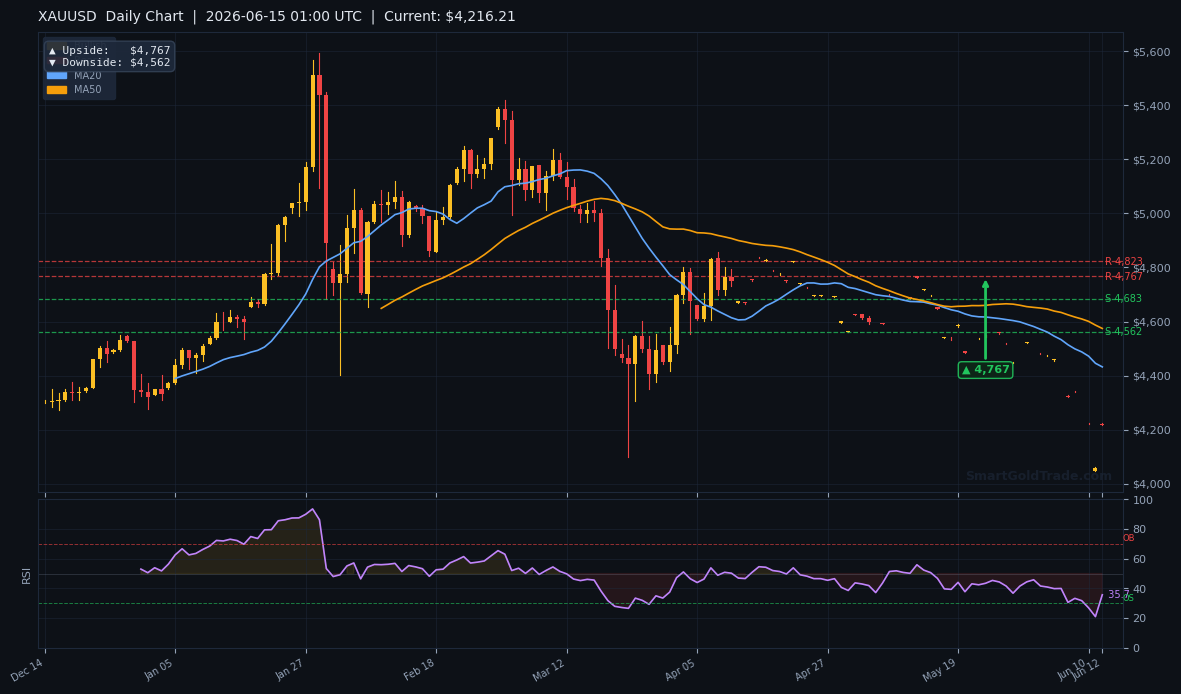
With the recovery well underway, former pivot resistances have now become the targets. The first upside hurdle is the former S2 pivot at $4,442.32, followed closely by the S1 pivot at $4,473.73. A clean break above both would signal that the corrective wave (d) referenced in last Friday’s Elliott Wave analysis is indeed in play, with the daily upside target at $4,767 becoming a realistic destination. On the downside, the critical support zone now lies between $4,280 and $4,300—the area that previously capped upside and now should flip to support. The Average True Range of $27.33 means daily swings of roughly $27 are typical, so any dip into that band would still be considered a healthy retracement within a bullish session.
Fundamental Drivers
Last week’s slide was compounded by a much stronger-than-expected U.S. retail sales print on Thursday, which hardened expectations that the Fed would stay restrictive. The subsequent Elliott Wave projection from LiteFinance called for wave (c) to bottom near $4,200 before a countertrend wave (d) lifted XAU/USD toward the $4,562–$4,767 zone. That forecast is already being validated by today’s $4,190 low and the ensuing bounce to $4,328. The upcoming FOMC decision remains the week’s centrepiece—markets have baked in a hold, but the summary of economic projections could easily catch traders off guard. A hawkish dot plot would likely send the gold price reeling toward $4,150, while a dovish lean would turbocharge the recovery straight toward the $4,442 pivot and beyond.
Key Event to Watch
The Federal Reserve’s rate announcement and updated projections on Wednesday, June 17, are the primary catalyst this week. While a 5.75% rate is a foregone conclusion, any hint that members are pulling forward rate-cut expectations could ignite a gold rally. Conversely, a hawkish shift—perhaps signalling cuts won’t arrive before 2027—would reignite dollar strength and pressure XAU/USD down to the $4,150 support. Traders should also monitor Wednesday’s Core CPI revision, as a softer figure could reinforce the dovish narrative and accelerate gold’s upward momentum.
Devil's Advocate
The contrarian setup now hinges on whether this morning’s bounce is a genuine reversal or merely a short-squeeze in thin Asian conditions. If the gold price fails to sustain levels above the MA50 at $4,310 and slips back below $4,280 on the H4 close, the entire recovery could unravel, sending XAU/USD back toward the $4,190 low—and potentially through it to $4,150. The risk is that today’s sharp up-move was entirely liquidity-driven, with real money waiting for the FOMC before committing. In that scenario, a failed retest of $4,200 would be the cue to exit longs and flip to a bearish bias, targeting the psychological $4,150 floor.
Trading Strategy for the Rebound
The original entry zone of $4,195–$4,210 is now history, with the gold price having rocketed over $100 higher within hours. Latecomers should resist the urge to chase the rally into the low-liquidity Asian afternoon. Instead, a patient approach works best: wait for a corrective pullback toward the $4,280–$4,300 region—former resistance that should now act as support—before considering fresh long positions. A move back to that zone coincides with the 50-period MA and a 38.2% Fibonacci retracement of the $4,190–$4,328 upswing.
Traders who want to execute this plan with a clear conscience can use our interest-free spot gold trading platform, which eliminates overnight swap fees and avoids leverage—keeping your capital Shariah-compliant even around high-impact events like the FOMC. For those who prefer confirmation before pulling the trigger, professional gold trading signals deliver real-time entry alerts the moment pivotal levels are retested, helping you act decisively without staring at charts all night.
Gold Price Key Takeaways
- Gold price reversed sharply, surging from $4,190 to $4,328.20 and reclaiming the MA50 in a single Asian session.
- The MA20 at $4,166.75 now serves as deep support; the MA50 at $4,310.42 has flipped to immediate support if held.
- RSI bounced to 55, reflecting bullish momentum that favours a continuation toward the $4,442 resistance pivot.
- The key upside hurdles are the former S2 pivot at $4,442.32 and S1 at $4,473.73—clearing both would target $4,767.
- Wednesday’s FOMC decision is the make-or-break event; a hawkish dot plot could drag gold to $4,150, while a dovish lean fuels a rally.
- Smart pullback entries near $4,280–$4,300 with a stop below $4,250 offer a favourable risk-reward for joining the recovery trend.
Conclusion
Gold price has transformed a bearish breakdown into one of the sharpest intraday recoveries of the month, vaulting back above $4,300 and invalidating the overnight sell signal. The technical picture now favours further upside, provided XAU/USD can hold above the reclaimed MA50 and consolidate near $4,328. While the FOMC holds all the cards for the rest of the week, the early price action suggests that a dovish surprise would simply add fuel to a fire already lit. Patience is still paramount—wait for a pullback to the $4,280–$4,300 zone before committing fresh capital, and keep a tight leash on risk should the Fed turn hawkish.
For those who prefer a longer-term approach, there’s another way to benefit from gold’s enduring value: you can purchase certified physical gold coins and bars directly through SmartGoldTrade’s Shariah-compliant store. Owning tangible 22K or 24K gold provides a halal hedge against inflation and currency erosion, whether or not you trade the day-to-day swings in the gold price.
FAQ
Where is gold price trading right now after the Asian session spike?
As of 02:30 UTC, XAU/USD is trading at $4,328.20, having rebounded nearly $140 from the session low of $4,190. The swift recovery has reclaimed the critical $4,200 psychological level and the 50-period moving average.
What are the key support and resistance levels for gold today?
Immediate support now sits at $4,280–$4,300, where prior resistance should turn into a floor. Below that, the next strong support is at $4,190, followed by $4,150. Resistance stands at the former pivot levels of $4,442.32 and $4,473.73, with the daily bullish target at $4,767 if momentum persists.
How does the upcoming Fed meeting affect the gold price outlook?
The FOMC decision on June 17 is the dominant catalyst. A hawkish stance—keeping cuts on ice for 2026—could force the gold price back down toward $4,150, while a dovish surprise or softer economic projections would likely accelerate the current recovery toward $4,442 and eventually $4,767.
Trading Gold (XAU/USD) carries significant risk of loss and is not suitable for all investors. This content is for informational purposes only and does not constitute financial advice. Always conduct your own research and trade responsibly.