The gold price is hovering at $4,213.53 this American session, stalling a fragile recovery that began after last week's Iran-driven spike. Traders are frozen, waiting for tangible progress in the US–Iran peace negotiations that dominated the weekend headlines. The metal's failure to hold gains above $4,235 on the 1‑hour chart tells a story of dwindling bullish conviction. With the 10‑year US Treasury yield ticking higher and the dollar index firming, pressure on non‑yielding assets is building. Recent data has been quiet, but the upcoming Federal Reserve meeting next week is already casting a hawkish shadow across rate‑sensitive markets. The volatility compression visible on the four‑hour timeframe suggests a breakout is imminent, making the $4,200 line a make‑or‑break level for the week.
Gold Market Overview
Macro Context
The US Dollar Index is holding above 105.0, fueled by yesterday's upward revision in the Atlanta Fed's GDPNow model and a steady drip of hawkish rhetoric from regional Fed presidents. The 10‑year Treasury note yield stands around 4.20%, elevating the opportunity cost of holding gold. Rate markets now price less than a 25% probability of a cut at the June 16–17 FOMC meeting, reinforcing a hostile backdrop for the yellow metal.
Geopolitically, last week's US strike on an Iranian cargo vessel jolted gold towards $4,220, but the subsequent ceasefire overtures have unwound the fear bid. Trading desks are in wait‑and‑see mode; any headline suggesting a concrete peace framework could accelerate profit‑taking on long positions. The absence of safe‑haven flows exposes gold to the weight of higher real yields.
Session Outlook
The American session brings peak liquidity and typically sees the largest directional moves of the day. With no tier‑one US data on the calendar, the focus will be purely on the wires from Vienna, where back‑channel US–Iran talks are reportedly ongoing. The ATR(14) of $27.33 suggests a probable intraday band between $4,186 and $4,240. A break of either boundary would signal a shift in the immediate trend. Expect stop‑hunting around the $4,200 psychological support, as market makers exploit the build‑up of resting orders just beneath the figure.
Traders should remain alert for a sudden liquidity vacuum during the New York lunch hour. The thin order books around 12:00–14:00 EST often amplify news‑driven spikes. As a volatility filter, the pending FOMC blackout period later this week will also reduce Fed‑speak, forcing the market to trade purely on geopolitical and technical flows.
Technical Analysis
Moving Average Structure
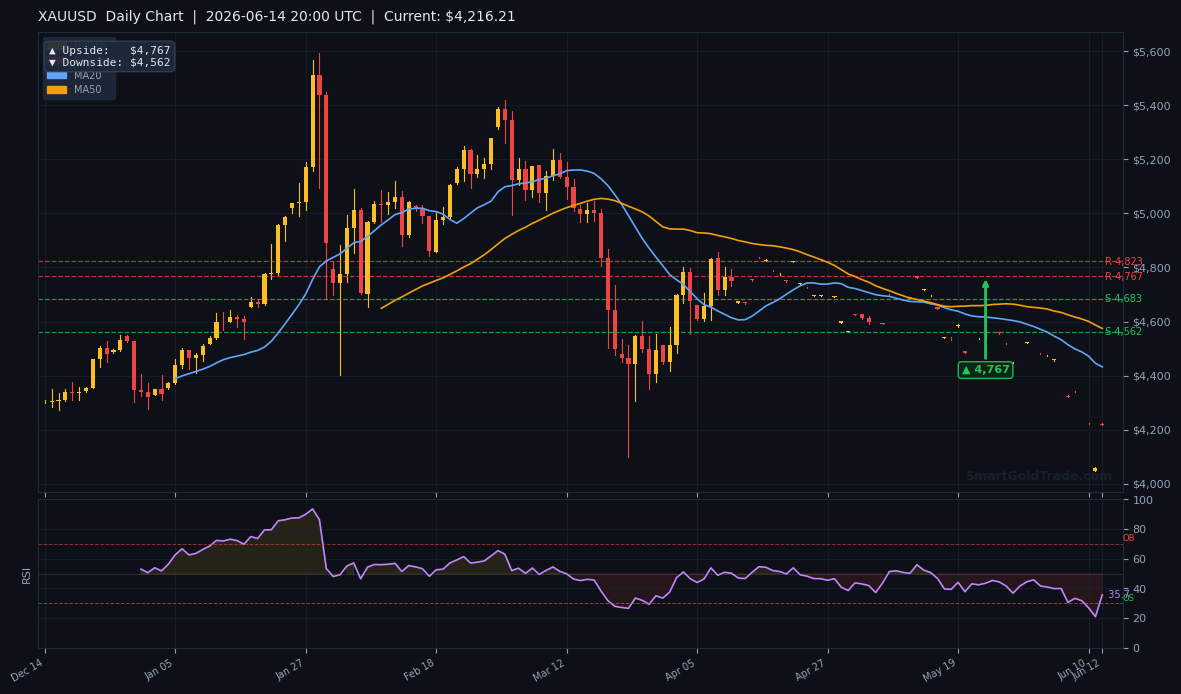
The moving averages paint a conflicted picture. The MA20 stands at $4,166.75, and with spot trading firmly above it, the short‑term momentum is superficially bullish. However, the MA50 at $4,310.42 looms overhead as a formidable barrier, while the MA200 at $4,513.79 confirms a deep bear territory on the long‑term chart. The EMA structure — where MA20 < MA50 — flags persistent short‑term bearish pressure despite the bounce from last week's lows. This alignment typically precedes a mean‑reversion move toward the moving average envelope, which currently sits near $4,310.
RSI and Momentum
The 14‑period RSI reads 48.5, squarely in the neutral zone. There is no oversold bounce catalyst, nor any overbought exhaustion signal. This reading supports a consolidation phase, allowing the price to coil before its next impulsive leg. A drift below 45 on the RSI would align with a break of $4,200, while a thrust above 55 would corroborate a push above $4,235.
Key Price Levels
The daily pivot framework places resistance at $4,536.14 (R1) and $4,513.84 (R2), while support is seen at $4,473.73 (S1) and $4,442.32 (S2). These levels sit well above the current price, highlighting how far gold has fallen from its mid‑trend structure. The more immediate battlefield lies between the 1‑hour downside target at $4,202 and the upside target at $4,235. A clean break below $4,200 would open the door to the 4‑hour downside objective of $4,442 — but that's a distant scenario.
Based on the ATR of $27.33, the expected intraday range spans roughly $4,186 to $4,240. That frames the entire American session's potential volatility.
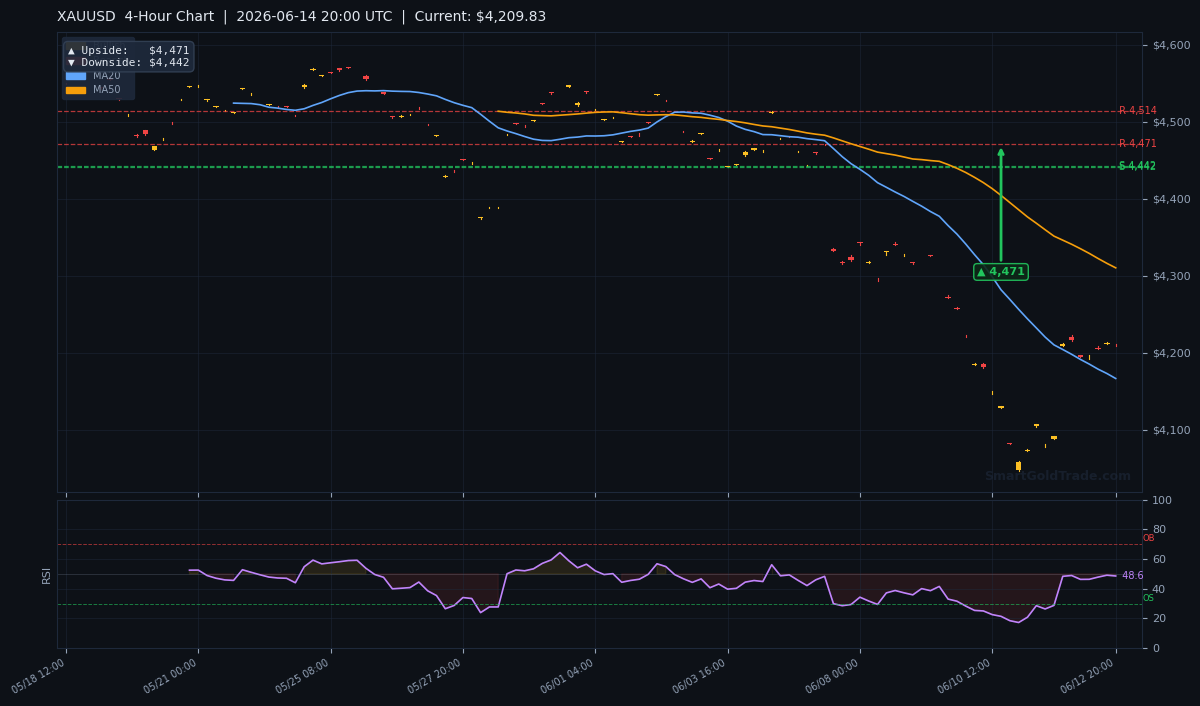
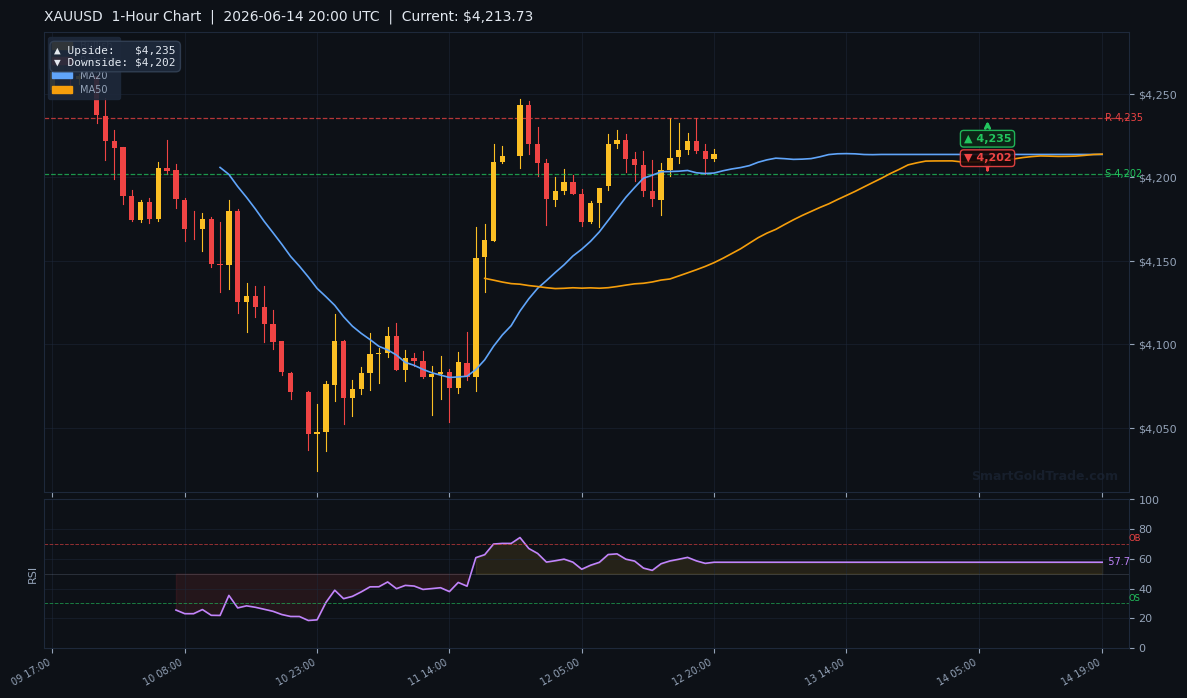
In summary of the technical picture, the following table illustrates the multi‑timeframe price targets pulled directly from the pivot arrows on the charts:
| Timeframe | Resistance | Support | Upside Target | Downside Target |
|---|---|---|---|---|
| Daily | $4,536.14 | $4,473.73 | $4,767 | $4,562 |
| 4‑Hour | $4,536.14 | $4,442.32 | $4,471 | $4,442 |
| 1‑Hour | $4,235 (chart) | $4,202 (chart) | $4,235 | $4,202 |
Fundamental Drivers
The overriding macro theme is the US–Iran peace negotiation, which is sucking the risk premium out of gold. FXStreet's latest sweep confirms the metal is pausing its recovery as traders wait for clarity. Every headline from the Vienna talks acts as a binary switch: a confirmed framework would likely ignite a sell‑off toward $4,173, while a collapse could send gold hurtling towards the 4‑hour upside target at $4,471. With no official statement yet, the default posture is one of caution — and caution favours the bear side when yields are rising.
The correlation with the DXY has tightened to -0.89 over the past 20 sessions, meaning any further dollar strength will disproportionately punish gold. The market is also digesting last Tuesday's ISM services print, which surprised to the upside and reinforced the “higher for longer” rate narrative. For gold to stage a sustainable rally, either the dollar needs to tumble or a geopolitical shock must override the yield calculus.
Key Event to Watch
The single most important catalyst this week is the FOMC meeting on June 16–17. Even though the blackout period has already begun, the mere anticipation of a hawkish hold is capping any upside attempts. If the dot plot or the statement leans even slightly more restrictive, the $4,200 floor will shatter. Traders should monitor Fed funds futures: a 5‑basis‑point increase in the implied December 2026 rate would be enough to trigger a cascade of algorithmic selling. On the flip side, a surprise dovish tilt — unlikely but not impossible given recent consumer credit data — would invalidate the bearish setup and target $4,310 (MA50) rapidly.
Devil’s Advocate
The bearish thesis stands on the fragile peace narrative and upcoming Fed hawkishness. But what if the US–Iran negotiations break down? A collapse of talks would swiftly resurrect the safe‑haven bid, driving gold through the 1‑hour resistance at $4,235. A daily close above that level would negate the immediate downside risk and set the stage for a run towards the 4‑hour upside target of $4,471. The dollar could also reverse if the European Central Bank’s minutes tomorrow surprise with hawkish language, weakening the greenback and giving gold a temporary reprieve. Veteran traders know that the market often punishes consensus — and consensus is heavily short right now. A short‑squeeze above $4,235 would be brutal and fast.
Trading Strategy for American Session
The highest‑probability setup is a short on a sustained break below the $4,200 handle. Enter after a 15‑minute candle close below $4,198, with a stop loss at $4,237 — just above the 1‑hour resistance and the upper end of the ATR envelope. Take‑profit targets are staggered: T1 at $4,175 and T2 at $4,160, both within the ATR‑based daily range. This risk‑reward ratio sits close to 1:2.
An alternative long entry triggers only upon a breakout above $4,235 on heavy volume. In that case, buy with a stop under $4,218 and target the $4,265 minor resistance, with a runner to $4,310. For traders who want to avoid riba, our halal gold trading platform lets you own physical gold spot without leverage. Real‑time, expert‑analyzed entry points can be found via professional gold trading signals from InvestorTipster. Those looking to hedge long‑term exposure may also consider purchasing physical gold coins and bars as a portfolio ballast.
Key Takeaways
- Gold price at $4,213.53 consolidates after last week's Iran‑fueled spike, with upside capped at $4,235.
- The $4,200 psychological support is the line in the sand; a daily close below opens $4,173 and $4,160.
- Neutral RSI at 48.5 and MA20 < MA50 structure keep the near‑term pressure bearish despite the bounce.
- The pending FOMC meeting (June 16‑17) and US‑Iran peace headlines will dictate the next 150‑pip move.
- A break above $4,235 invalidates the bearish outlook and targets $4,471 (4‑hour upside).
- ATR of $27.33 projects an American session range of $4,186 – $4,240; traders should avoid entering in the middle of this zone.
Conclusion
The gold price is walking a tightrope. Between a hawkish Federal Reserve on one side and delicate US‑Iran peace talks on the other, conviction is running thin. Price action suggests that sellers are gaining the upper hand near the $4,235 resistance, and the defence of $4,200 will probably determine the trend for the rest of June. A failure to hold here would shift the bias aggressively lower, with the 4‑hour downside target of $4,442 serving as a medium‑term magnet. Conversely, only a macro shock or a diplomatic deadlock can rescue the bulls. The next 48 hours are critical; trade accordingly and honour your stops.
Frequently Asked Questions
- What is the current gold price today?
- The gold price is trading at $4,213.53 during the American session on June 14, 2026, based on live market data.
- What is the most important support level for gold right now?
- The psychological $4,200 level is the immediate floor, reinforced by the 1‑hour downside target of $4,202. A break below this zone exposes $4,173.
- What could push gold below $4,200?
- A decisive move in US‑Iran peace negotiations or a hawkish surprise from the upcoming FOMC meeting could drive the metal through $4,200. Higher Treasury yields and a stronger dollar are additional bearish catalysts.
- What is the expected gold price range during the American session?
- Based on the ATR of $27.33, the likely range spans from $4,186 to $4,240. Extended volatility could stretch this range by 15–20 pips on either side.
- Where is the next resistance if gold rallies?
- The first resistance is the 1‑hour upside target at $4,235. Above that, the next major hurdle is the 4‑hour upside target at $4,471, followed by the daily target of $4,767.
Trading Gold (XAU/USD) carries significant risk of loss and is not suitable for all investors. This content is for informational purposes only and does not constitute financial advice. Always conduct your own research and trade responsibly.