Gold enters the new trading week near $4,213.53 after surviving a brutal sell‑off that briefly sent prices crashing to a seven‑month low of $4,080. Last week’s price action was a tug‑of‑war between aggressive Fed rate‑hike expectations and geopolitical turbulence around Iran, with Friday’s headlines that the Iran war had ended triggering a sharp relief rally.
This gold price forecast next week examines how the upcoming FOMC decision, key US data, and a fragile technical structure will shape XAU/USD between June 14 and June 20, 2026. We pinpoint exactly where buyers and sellers are likely to emerge and deliver trading scenarios built on hard technical levels.
Last Week in Review
Price Action Recap
The week opened with gold already under pressure near $4,320, then cascading lower as markets repriced the probability of a June Fed hike to 70% ahead of the May CPI release.
By Wednesday, XAU/USD had collapsed to $4,080 — a level not seen since November 2025 — as a combination of surging US yields and safe‑haven flows into the dollar overwhelmed the metal. A brief respite came when the actual CPI print of 4.2% y/y came in slightly below the most hawkish whispers, but the damage was done.
The remainder of the week was a slow grind higher, with gold reclaiming $4,185 by Thursday and then exploding back above $4,200 late Friday after former President Trump claimed the Iran conflict had concluded. The weekly range of roughly $200 underscores the extreme volatility traders faced.
Key Events That Moved Gold
Last week’s primary driver was the May US CPI report. The actual 4.2% year‑over‑year number, while still far above the Fed’s 2% target, reinforced the narrative that inflation is proving stickier than anticipated, pushing Fed funds futures to price in a 70% chance of a hike at this week’s meeting. That hawkish repricing hammered non‑yielding gold, sending it to $4,080.
The second pivotal catalyst was the geopolitical whipsaw around Iran. Fears of a protracted conflict had paradoxically failed to provide a lasting safe‑haven bid, as investors flocked to the US dollar instead. When war tensions de‑escalated on Friday, gold’s reprieve came not from risk‑off buying but from a softer dollar and a retracement in real yields. Additionally, a bearish crossover on the daily chart and multiple analyst notes from ForexFactory and FXStreet reinforced the bearish sentiment, keeping rallies limited.
Weekly Close Analysis
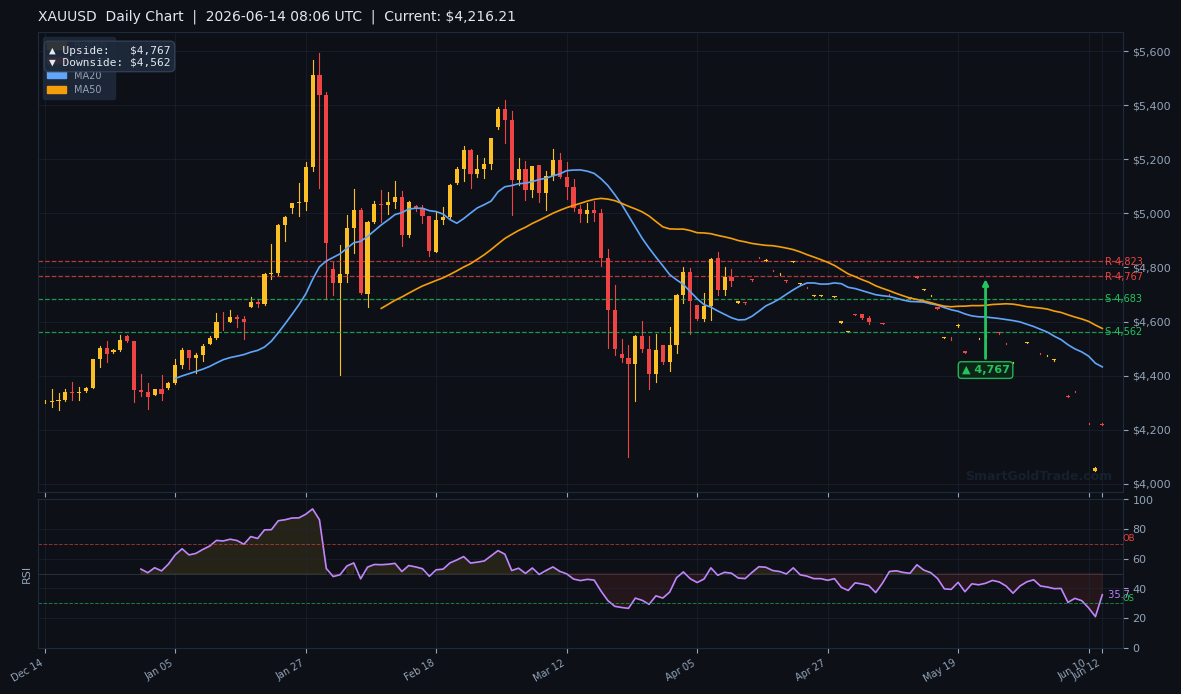
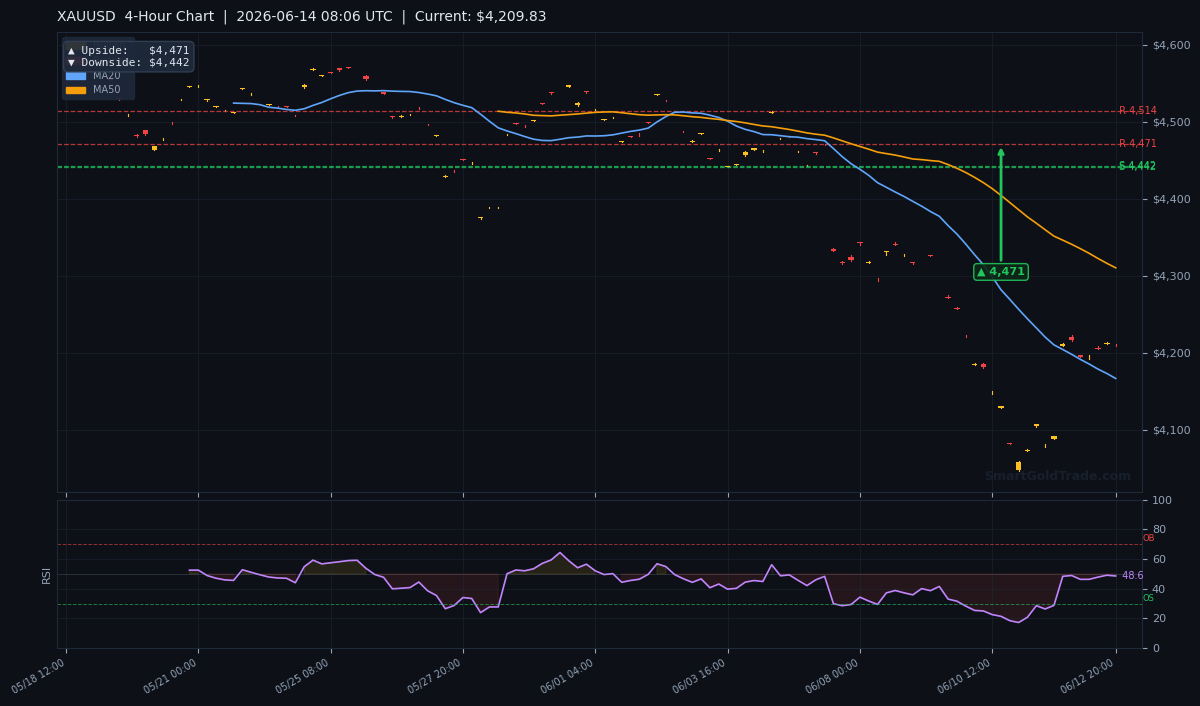
Gold settled the week at $4,213.53, printing a pronounced hammer candlestick on the weekly timeframe — a formation that often marks capitulation selling followed by buying pressure. The close reclaimed the critical $4,200 psychological floor and sits just above the 20‑period H4 moving average of $4,166.75.
However, the weekly closing price remains well below the intermediate‑term 50‑MA ($4,310.42) and the long‑term 200‑MA ($4,513.79), leaving the broader bearish structure intact. The hammer’s low at $4,080 now becomes a major invalidation point for bulls; a weekly close above $4,320 is needed to shift the technical bias. For now, the weekly close is a tentative stabilisation rather than a trend reversal.
Gold Price Forecast Next Week: Economic Calendar & Impact
The June 14–20 calendar is front‑loaded with high‑impact US events that will determine whether gold catches a sustainable bid or retests the lows. Below is the day‑by‑day breakdown and a summary table.
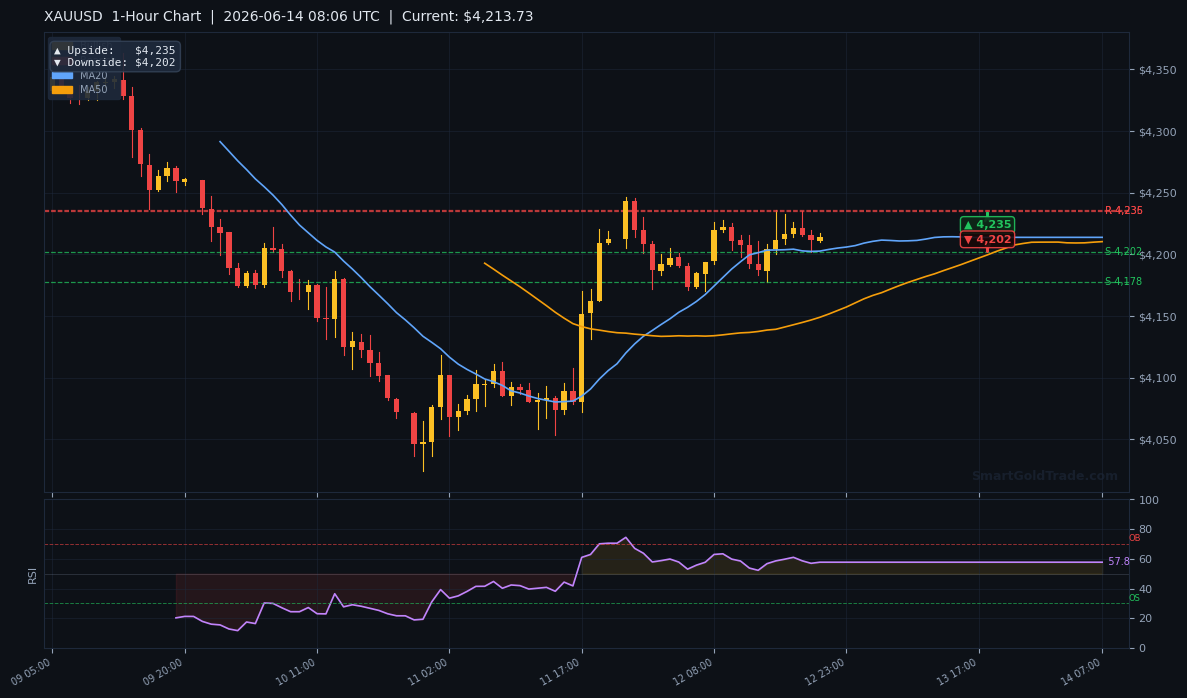
Monday, June 15 – A quiet start. No top‑tier US data; markets will trade on momentum from the prior week and position ahead of Tuesday’s retail sales. Expect choppy, two‑way action within the $4,200–$4,235 zone.
Tuesday, June 16 – US Retail Sales (Core) m/m (high impact). Forecast is 0.3% (previous 0.5%). A stronger reading would suggest the US consumer remains resilient, fueling hawkish bets and likely pushing gold below $4,200. A miss would reignite recession fears, boosting gold toward $4,235 and beyond.
Wednesday, June 17 – FOMC Interest Rate Decision (maximum impact). The Fed is universally expected to hold rates at 5.50%, but the dot plot and Chair Powell’s press conference are the real risk. A hawkish hold — signalling a July hike — could send gold crashing back toward $4,080. A dovish tone acknowledging slowing growth would catalyse a rally through $4,235, targeting $4,320.
Thursday, June 18 – Weekly Jobless Claims and Philly Fed Manufacturing Index. Any sharp jump in claims (above 230K) would be read as labour market softening, bullish for gold. A strong Philly Fed print would work the opposite way. Range swings are likely.
Friday, June 19 – Quadruple Witching — no major economic releases, but options and futures expiries can inject sudden volatility. Gold often sees late‑day positioning adjustments; risk management is essential.
| Day | Event | Forecast | Previous | Gold Impact |
|---|---|---|---|---|
| Mon 15 | No major US data | – | – | Range‑bound, volatility low |
| Tue 16 | US Retail Sales (Core) m/m | 0.3% | 0.5% | Above forecast = bearish gold; below = bullish |
| Wed 17 | FOMC Rate Decision + Presser | 5.50% | 5.50% | Hawkish hold = gold sell‑off; dovish = rally |
| Thu 18 | Jobless Claims, Philly Fed | 215K / 8.0 | 218K / 6.5 | Weak claims/Philly = bullish gold; strong = bearish |
| Fri 19 | Quadruple Witching | – | – | Elevated intraday swings |
Technical Analysis
Moving Average Structure
The H4 chart reveals a conflicted short‑term picture. The current price of $4,209.83 trades above the 20‑period MA at $4,166.75, a tentative bullish sign for the immediate trend. However, the price remains firmly below the 50‑MA ($4,310.42) and the 200‑MA ($4,513.79), keeping the medium‑ and long‑term outlook bearish.
Critically, the EMA structure is ordered MA20 < MA50, indicating that short‑term momentum is still subservient to the broader downswing. This dynamic signals that rallies into the $4,310–$4,320 zone are likely to attract sellers until proven otherwise.
RSI and Momentum
The 14‑period Relative Strength Index stands at 48.5, squarely in neutral territory. This reading suggests that neither buyers nor sellers have seized decisive control after last week’s recovery. An RSI push above 55 would be needed to confirm bullish momentum; conversely, a slide below 40 would open the door to another test of the $4,080 low. For now, momentum is idle, leaving gold vulnerable to headline‑driven swings.
Key Support and Resistance Levels
The technical structure around current price is defined by tightly packed pivot levels. Immediate resistance sits at the 1‑hour upside target of $4,235, followed by the structurally important $4,320 (weekly closing level and 50‑MA). Above there, pivot targets derived from the daily analysis point to $4,442.32 (S2) and $4,473.73 (S1).
The upper resistance band extends to $4,513.84 (R2) and $4,536.14 (R1). On the downside, $4,202 — the 1‑hour downside target — is the first support; a break below exposes $4,185 and then the critical $4,080 swing low.
The Average True Range (ATR) of $27.33 on the H4 chart implies a weekly average swing of roughly $60–$65, projecting a trading band of $4,148–$4,278 under normal volatility conditions. Traders should use these levels to calibrate risk.
Trading Scenarios This Week
Bullish Scenario (probability 35%)
A bullish reversal would require a sustained breakout above the $4,235 resistance, ideally triggered by a dovish FOMC outcome or a sharp miss in US retail sales. In this case, entries near $4,208–$4,220 with a stop‑loss below $4,200 offer favourable risk‑reward. The first upside target is the 4‑hour upside projection of $4,471, with an extended objective at the daily upside target of $4,767.
Partial profit‑taking near $4,320 is prudent, as the 50‑MA will likely cap initial rallies. For traders seeking precision timing, professional gold trading signals can pinpoint real‑time entry and exit levels. This scenario remains secondary to the bearish bias, but a stable weekly close above $4,320 would flip the outlook decidedly higher.
Bearish Scenario (probability 55%)
The dominant scenario expects the Fed to deliver a hawkish hold or US retail sales to beat estimates, validating the bearish EMA structure. Aggressive sellers will short a rejection at $4,235–$4,260, targeting a breakdown below $4,202. The initial bearish objective is a retest of $4,080, followed by a potential extension to the psychological $4,000 mark.
A stop‑loss placed above $4,280 keeps risk contained. The weekly close forecast suggests gold is more likely to finish near the lower end of the $4,148–$4,200 range if the data‑heavy week reinforces the high‑rate narrative. Traders on a halal gold trading platform can execute spot, interest‑free positions without leverage concerns during this volatile period.
Neutral / Range‑Bound Scenario
With the Fed meeting falling mid‑week, price may coil into a tight range before the announcement. A pre‑FOMC holding pattern between $4,202 and $4,235 is likely to dominate until the FOMC statement injects direction. A break on either side will likely trigger stops and accelerate the move.
Overall, our gold price forecast next week leans bearish as long as gold stays below $4,320. The FOMC decision and US retail sales will be the make‑or‑break catalysts. Traders should stay nimble, use tight risk controls, and let the data confirm direction before committing.
FAQ
What is the gold price forecast for next week? Based on current technicals and a hawkish-leaning Fed, gold is likely to face resistance near $4,235–$4,260 and could retest the $4,080 low if the FOMC reinforces rate-hike expectations. A clean break above $4,320 would flip the short-term outlook bullish.
What key events will affect gold next week? The FOMC rate decision on Wednesday, US retail sales on Tuesday, and jobless claims/Philly Fed on Thursday are the most impactful. Hawkish surprises can push gold sharply lower, while a dovish tone or weak data could spark a relief rally.
How should traders position for next week’s gold forecast? Aggressive traders can short rejections near resistance with stops above $4,280, or buy on dips if the FOMC turns dovish. For a Shariah‑compliant, hands‑off approach, consider using a halal trading platform or copying seasoned traders during this news‑heavy window.