Gold price is soaring this Friday, trading at $4,201.23 per troy ounce after yesterday's European Central Bank decision triggered a sharp dollar unwind. The metal had been pinned near the $4,090 support zone on Thursday, with XAU/USD closing the pre-ECB session at $4,091.53. Now the oversold bounce that traders were watching has materialized, lifting the gold price back toward the 1‑hour upside target of $4,222. With the RSI rebounding out of oversold territory and the greenback under fresh pressure, the short-term picture has flipped from defensive to constructive.
Gold Price Overview
Macro Context
The U.S. Dollar Index tumbled through the 104.80 floor after the ECB delivered a hawkish 25‑basis‑point hike and President Lagarde refused to rule out further tightening. Ten‑year Treasury yields remain elevated near 4.50%, a headwind for non‑yielding gold. Meanwhile, simmering geopolitical tensions in Eastern Europe and the Middle East keep a safe‑haven bid alive. Physical demand continues to put a floor under extreme sell-offs—many investors still purchase physical gold as a portfolio hedge.
How the ECB Sparked the Gold Price Rally
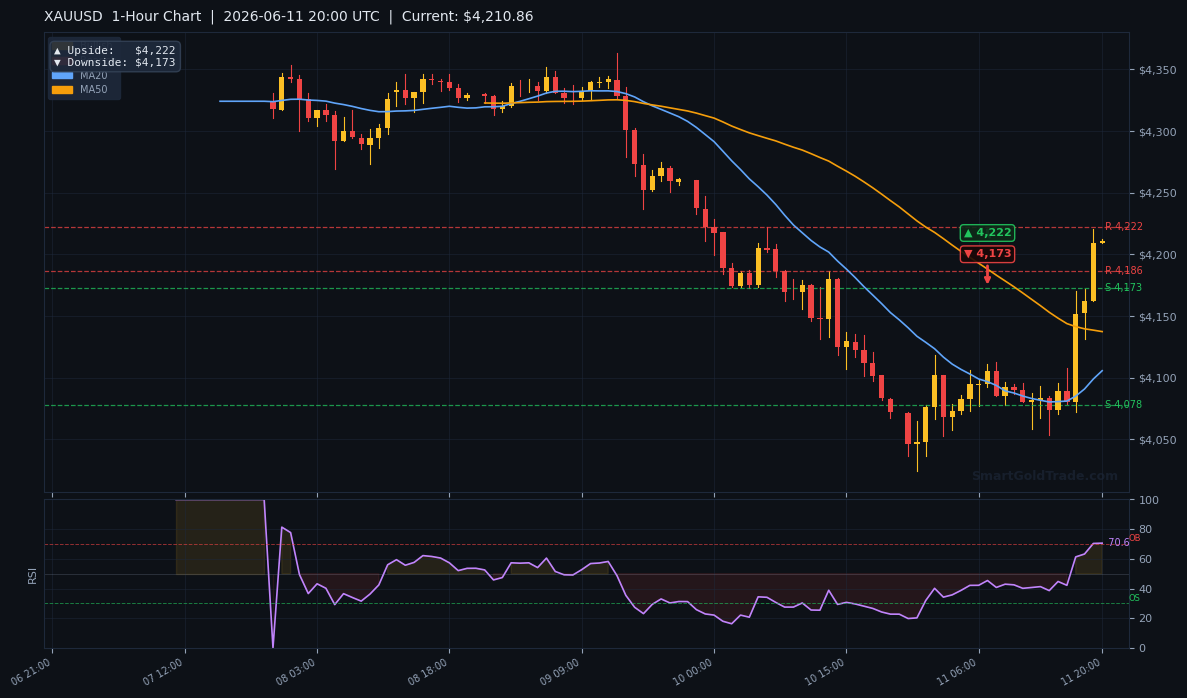
When the ECB hiked rates and signaled that the fight against sticky inflation wasn't over, EUR/USD surged above 1.1600 for the first time in months. The resulting dollar sell-off lifted gold price from the $4,090 support zone straight to $4,201.23 inside a single session. This move confirms the mean-reversion thesis that had been building around the deeply oversold RSI reading. The one-hour swing target of $4,222 is now within striking distance, and a close above that level would bring the four-hour objective of $4,514 into play.
Gold Price Technical Analysis
Moving Average Structure
The moving average stack still bears a cautious tilt. The 20‑period MA at $4,210.40 and the 50‑period MA at $4,351.59 both slope lower, though the gold price is now pressing against the 20-MA. The 200‑period MA at $4,526.89 confirms the longer-term downtrend. Critically, the MA20 remains below the MA50—a death cross that continues to cast a shadow. A sustained break above $4,210.40 would be the first technical sign that the relief rally has legs.
RSI and Momentum
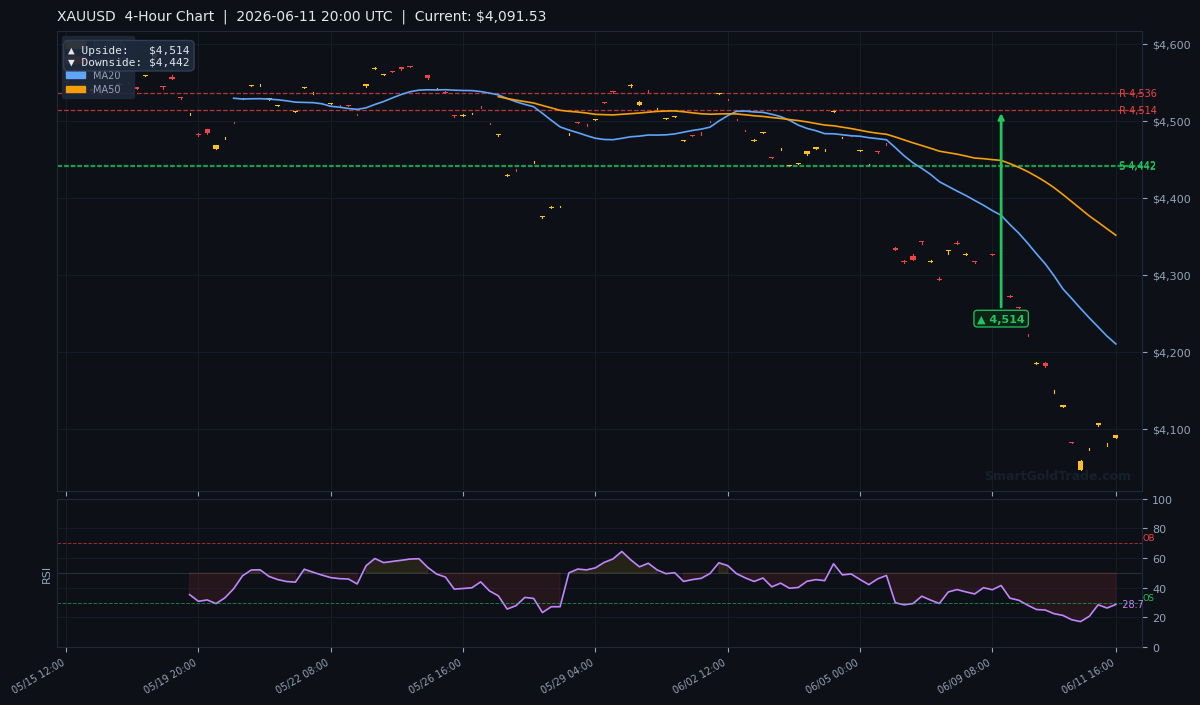
The 14‑period Relative Strength Index had printed an extreme 28.7 just before the ECB decision—a level that has historically marked interim lows. Over the last 24 hours the oscillator has climbed out of oversold territory, indicating genuine momentum return rather than a dead‑cat bounce. The Average True Range at $29.20 reminds us that intraday swings of $40–$60 are still normal, so even a healthy rally will contain sharp pullbacks.
Key Price Levels
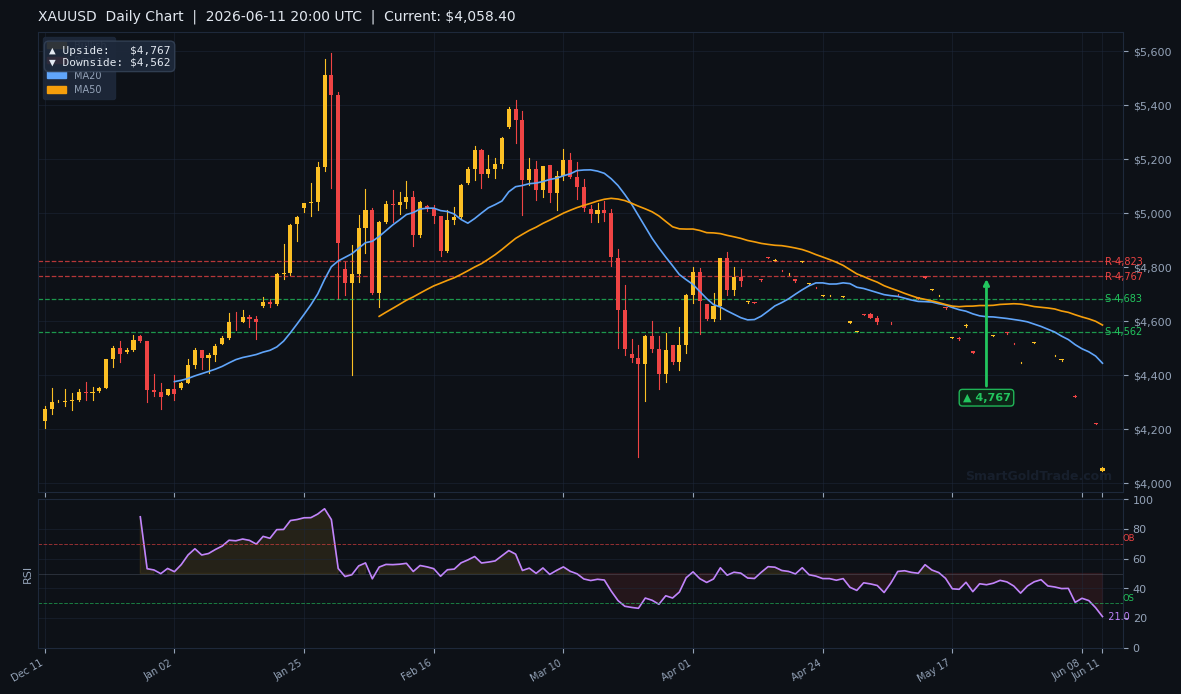
From the pivot calculations, the main support levels stand at $4,473.73 (S1) and $4,442.32 (S2), while resistance is marked at $4,571.58 (R1) and $4,536.14 (R2). Because all four levels are above the current gold price, upside progress must first clear the nearer hurdles. The most actionable objectives right now are the 1‑hour upside target at $4,222 and the 4‑hour upside target of $4,514.
| Timeframe | Upside Target | Downside Target |
|---|---|---|
| Daily | $4,767 | $4,562 |
| 4-Hour | $4,514 | $4,442 |
| 1-Hour | $4,222 | $4,173 |
Fundamental Drivers
The ECB's refusal to signal an end to its hiking cycle flipped the script for the gold price. A hawkish hike that emphasized persistent inflation was exactly the scenario that threatened the dollar's safe‑haven premium and handed the oversold metal a catalyst. The DXY/gold inverse correlation remains tight; any renewed weakness in the dollar index will likely see the gold price test $4,222, while a bounce in DXY above 105.00 could stall the recovery.
Key Event Recap
The ECB delivered a 25‑basis‑point hike on Thursday, and Lagarde's press conference avoided the dovish pivot that many had feared. EUR/USD rocketed through 1.1600, DXY dropped below 104.80, and gold price launched from $4,091.53 to $4,201.23 in a textbook oversold bounce. This reinforces how central bank communication can be a make‑or‑break driver for XAU/USD.
Devil's Advocate
Even with the rally, risks remain. If the U.S. jobs market continues to show strength next week, the Fed narrative could harden again, lifting the dollar and capping gold price. A daily close back below $4,090 would invalidate the bounce and open a path toward the April low of $4,070. The bearish moving average alignment hasn't been broken yet, so bulls need confirmation—a close above $4,222—before calling a trend change.
Trading Strategy for the Next Move
With gold price now at $4,201.23, the risk‑reward favours watching the battle at $4,222. A breakout on the hourly chart would offer a clean long entry, targeting the four‑hour objective of $4,514. For pullback entries, the $4,173 one‑hour level and the $4,090 psychological zone serve as logical support. A stop below $4,070 keeps risk within one ATR.
Traders seeking Shariah‑compliant execution can use Shariah-compliant spot gold trading to avoid swaps and leverage. And for those who want an extra layer of confirmation as gold probes resistance, real-time trading alerts can pinpoint momentum shifts during volatile American sessions.
Key Takeaways
- Gold price at $4,201.23 has rebounded sharply from the $4,090 support zone following the ECB's hawkish rate hike.
- The oversold RSI of 28.7 correctly flagged a mean‑reversion move—a pattern that has historically produced $50+ bounces.
- Immediate resistance stands at $4,222; a daily close above that level would target the four‑hour objective of $4,514.
- An ATR of $29.20 means $40–$60 intraday swings are common, so stops should be placed with ample breathing room.
- The bearish moving average stack keeps the medium‑term trend negative; the 20-period MA at $4,210.40 is the first real test for the bulls.
- A failure to hold $4,090 would shift focus back to the $4,173 downside target and the $4,070 April low.
Conclusion
Gold price has turned a corner this Friday, with the ECB decision acting as the spark that lit the oversold powder keg. A sustained break above $4,222 would confirm the end of the corrective phase and put the four‑hour target of $4,514 on the map. If the dollar regroups, however, gold price could quickly retreat toward $4,090. Let the close decide the trend, keep position sizes small relative to the wide ATR, and stay nimble—this gold price surge needs follow‑through to become something more than a relief rally.
Gold Price FAQ
- What is the current gold price?
- As of June 12, 2026, gold price stands at $4,201.23 per troy ounce, up sharply after the ECB decision.
- Why did gold price jump after the ECB meeting?
- The ECB delivered a hawkish rate hike and refused to signal an end to tightening, which weakened the U.S. Dollar and ignited an oversold bounce in gold.
- What are the key resistance levels for gold price now?
- The immediate resistance is $4,222, followed by the four‑hour target at $4,514. A break above $4,222 would confirm a short‑term bottom.
- Is gold still oversold?
- The RSI has climbed out of oversold territory from its previous 28.7 reading, indicating that momentum has shifted—but the rally still needs to prove itself above the 20-period MA.
- Where should I place a stop loss if I buy gold now?
- A logical stop sits below the recent swing low at $4,070, which provides a buffer of roughly one ATR and keeps risk manageable.
Trading Gold (XAU/USD) carries significant risk of loss and is not suitable for all investors. This content is for informational purposes only and does not constitute financial advice. Always conduct your own research and trade responsibly.