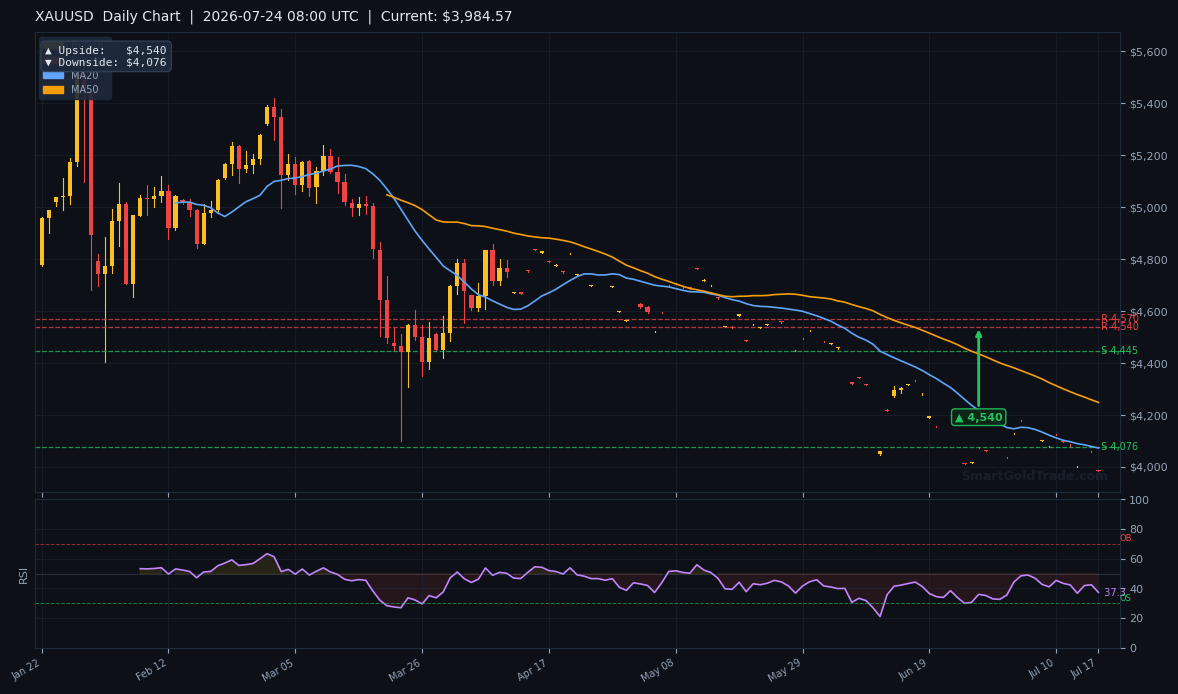
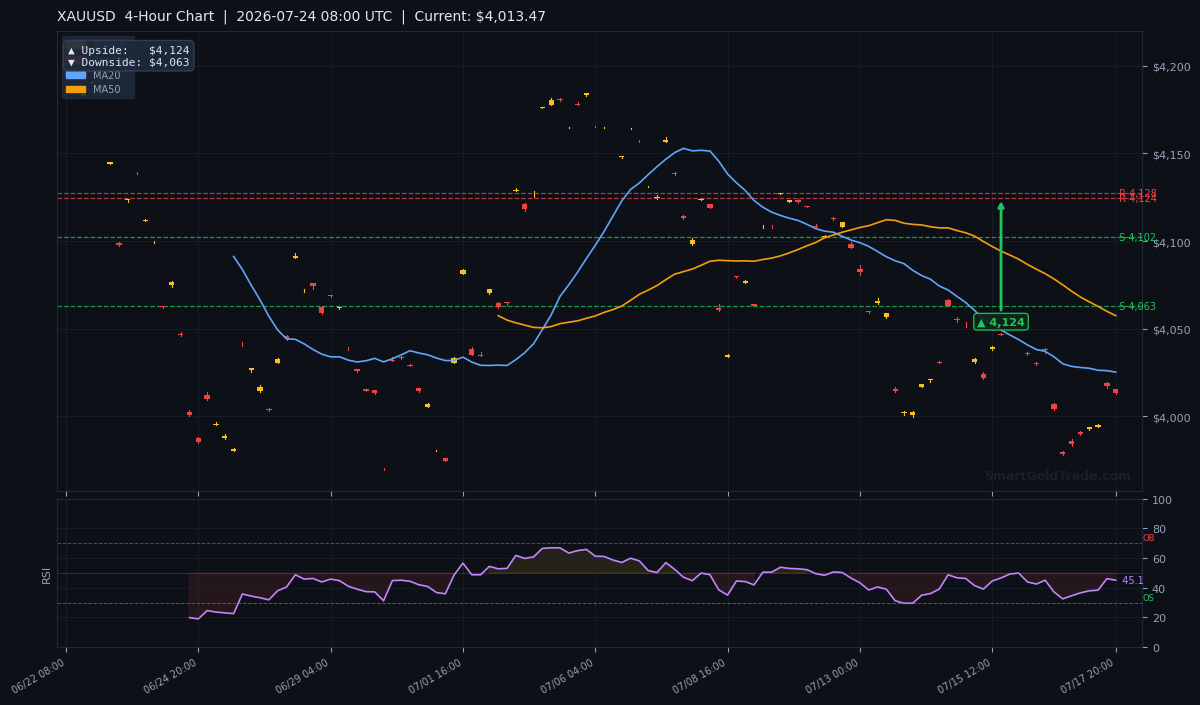
Gold price opens the European session on Friday at $4,052.54, recovering slightly from an overnight dip, but intraday charts tell a much darker story. The XAUUSD pair printed $4,013.47 on the 4‑hour frame, slamming below all major moving averages after yesterday’s uneventful ECB meeting. Bears are now targeting the $4,063 make‑or‑break level, a line that held multiple times this week but is now under direct threat. With the MA20 crossing below the MA50 and RSI sloping into bearish territory, momentum is shifting rapidly. This analysis dissects the technical structure, the post‑ECB macro landscape, and a concrete trading plan to navigate the breakout risk.
Gold Price Market Overview
Macro Context
Yesterday the European Central Bank held rates at 2.4% and 2.25%, exactly as predicted, offering no dovish surprise to lift gold. The dollar index firmed above 100.5 overnight, while US 10‑year yields edged back toward 4.15%, keeping non‑yielding assets under pressure. Soft Chinese manufacturing PMI earlier this week already hinted at slowing global demand, and geopolitical tension in the Middle East has not yet escalated beyond oil‑market jitters. The net effect is a macro environment that starves gold price of safe‑haven inflows while strengthening the dollar.
Session Outlook
London liquidity often compresses ranges around the fix, but today’s opening below the $4,025 moving average signals that the real move may start early. European traders will watch whether $4,063 survives the first test; a breakdown there would open the door to the $4,076 daily pivot target. The ATR of $12.14 suggests a realistic range of $4,001 to $4,025 for the session, with the bias pointing south. Any bounce toward the $4,025 zone is likely to attract fresh selling.
Technical Analysis
Moving Average Structure
The MA20 sits at $4,025.26, the MA50 at $4,057.47, and the MA200 at $4,159.27. Price at $4,013.47 is below all three, confirming a bearish alignment. More telling, the MA20 has crossed below the MA50—a short‑term bearish pressure signal that historically precedes extended declines. Until XAUUSD reclaims the MA20, every rally is suspect.
Why the MA Cross Matters
A death cross on the 4‑hour chart often triggers a 2–3% extension in the direction of the break, which would push gold price toward the $4,000 psychological magnet. The wide gap between the MA200 and spot price underscores how much of the long‑term uptrend is being tested right now. When shorter‑term averages converge like this, algorithmic traders tend to pile in, accelerating downside momentum. That’s precisely the scenario unfolding this morning.
RSI and Momentum
The 14‑period RSI reads 45.1, comfortably in neutral territory but tilting lower. It never reached oversold, meaning there is room for further selling without an immediate snap‑back. Momentum on the 4‑hour chart shows consecutive lower highs, reinforcing the bearish bias. A push below 40.0 on the RSI would confirm an acceleration of the down move.
Key Price Levels
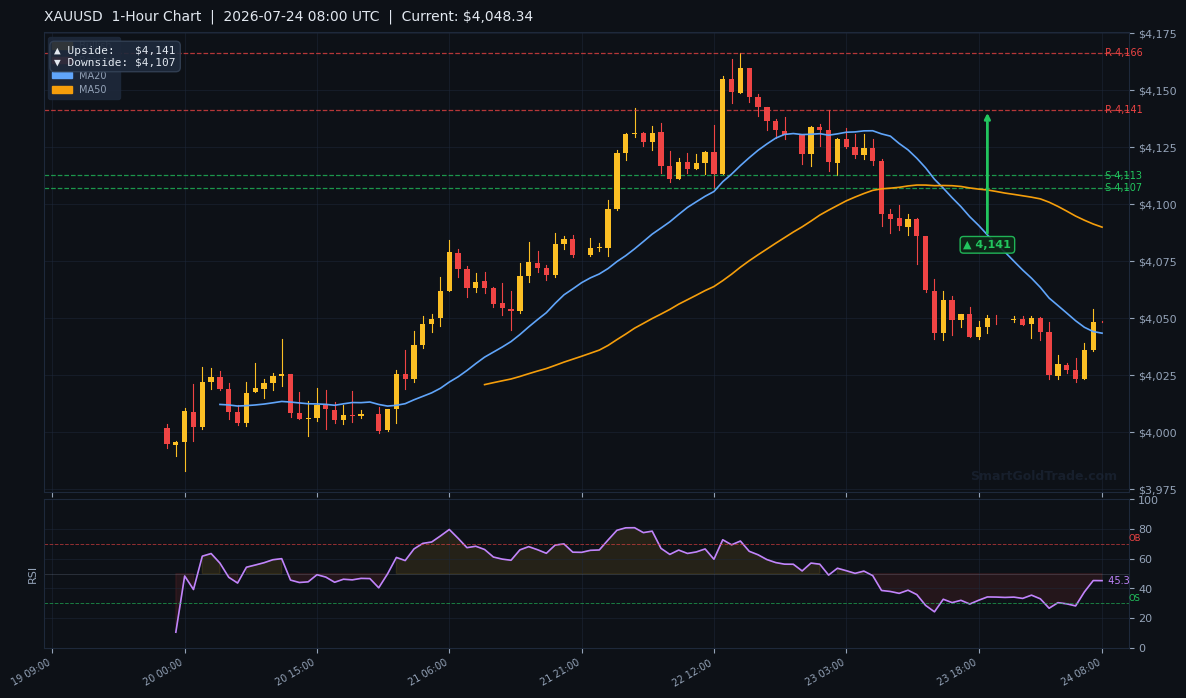
Pivot‑based levels drawn from the live charts mark the battlefield. S1 at $4,147.61 and S2 at $4,124.26 now act as overhead resistance, far above the current print. Resistance R1 at $4,164.23 and R2 at $4,159.15 form a ceiling that will cap any violent short‑covering. On the downside, the 4‑hour pivot arrow points to $4,063, while the 1‑hour downside is $4,107. The ATR‑based expected daily range of $12.14 places the lower session band near $4,001.
The $4,063 level is particularly sensitive because it has served as both support and resistance over the last two weeks. A clean break below it would invalidate the consolidation pattern and expose the $4,000 handle, a magnet for round‑number psychological trading. Traders should watch for a 15‑minute close beneath $4,063 to confirm the breakout before committing size.
Fundamental Drivers
Yesterday’s ECB decision left rates at 2.4% and 2.25%, giving no reason for gold bulls to cheer. The absence of a rate cut or fresh stimulus hints kept the euro capped and the dollar bid, directly weighing on gold price. Meanwhile, Fed‑funds futures still price a 70% chance of a US rate cut in September, but that distant optimism is being overshadowed by near‑term dollar strength. Oil prices remained choppy, not enough to ignite a stagflation trade.
Key Event to Watch
Next week’s US GDP and core PCE data will be the true catalysts. If the PCE deflator surprises to the upside, hawkish repricing could push gold below $4,000. Until then, the market will trade on technicals and ECB aftermath. For traders seeking Shariah‑compliant exposure, SmartGoldTrade’s interest‑free spot gold trading eliminates overnight swap costs while allowing precise entries at these levels.
Devil's Advocate
The bearish setup fails if XAUUSD reclaims the $4,124 4‑hour pivot upside and closes above the MA20. A sudden geopolitical shock or a sharp drop in US yields could trigger such a reversal. The line in the sand is $4,124: above it, shorts must cover, and a quick rally to $4,141 (the 1‑hour upside target) is likely.
Trading Strategy for European Session
Sell XAUUSD in the $4,010–$4,025 entry zone, using a stop loss at $4,124. The first take‑profit is the 4‑hour downside pivot at $4,063; a second target at $4,000 aligns with the ATR‑extended range. For dual confirmation, consider professional gold trading signals that align with our technical forecast. Position size according to the $12.14 ATR, and avoid risk exceeding 1–2% of capital.
Alternative Play: Accumulate Physical Gold on Dips
While short‑term trades around gold price can yield quick returns, many Shariah‑minded investors use these pullbacks to dollar‑cost average into tangible assets. With spot trading near the $4,050 region, buying physical gold now can strengthen a long‑term portfolio without the stress of monitoring intraday charts. SmartGoldTrade’s store lets you purchase physical gold in 22K coins, 24K bars, or certified jewelry, all fully allocated and Shariah‑compliant. Having bullion in hand during uncertain macro conditions offers a hedge that paper positions simply cannot match.
Key Takeaways
- Gold price spot near $4,052.54, but chart price $4,013.47 shows aggressive selling
- MA20 below MA50 at $4,025.26 and $4,057.47 confirms short‑term bearish pressure
- RSI at 45.1 leaves room for further downside before oversold
- Immediate support $4,063 (4‑hour pivot); break targets $4,076 daily downside
- Resistance at $4,124.26 (S2 pivot) must hold to keep bears in control
- ATR $12.14 implies a session range of roughly $4,001–$4,025
Conclusion
Gold price faces a decisive test at $4,063 this European session. The moving‑average structure and post‑ECB macro winds favour a break lower, with targets extending to $4,076 and $4,000. As long as XAUUSD remains below the MA20 at $4,025.26, the path of least resistance is down. Use tight risk parameters and stay alert for any headlines that could flip the dollar, but until $4,124 is violated, the bears have the edge.
FAQ
- Why is gold price falling today?
- The MA20/MA50 bearish cross and yesterday’s ECB rate hold strengthened the dollar, pushing XAUUSD below $4,025 and toward the $4,063 support.
- What is the next gold price support if $4,063 breaks?
- The daily pivot downside is $4,076, but a sustained break of $4,063 would likely see accelerated selling toward $4,000.
- Can gold price recover above $4,100 today?
- A bounce would need to clear the 1‑hour upside target at $4,141. As long as price stays below $4,124.26, the bearish bias dominates.
- What is a safe stop‑loss level for a short position?
- A stop above $4,124, the 4‑hour upside pivot, gives enough buffer against intra‑session noise while keeping the trade aligned with the trend.
Risk Disclaimer: Trading Gold (XAU/USD) carries significant risk of loss and is not suitable for all investors. This content is for informational purposes only and does not constitute financial advice. Always conduct your own research and trade responsibly.