The gold price climbed to $4,164.94 during American trading on Sunday, extending Friday's sharp rally after a significantly weaker-than-expected US Non-Farm Payrolls report. The NFP data, released on July 3, showed the US economy added far fewer jobs than forecast, prompting a fresh wave of dollar selling and pushing XAU/USD through the $4,150 barrier.
While the short-term momentum remains bullish, the move places gold in a critical technical zone — directly under the 200-day moving average at $4,293.43 and within striking distance of key resistance near $4,207.82. Veteran traders know that post-NFP rallies often fade when sentiment extremes unwind. This article examines whether the gold price has the strength to sustain its breakout or if a sharp reversal is looming for the American session.
Gold Market Overview
Macro Context
The softer Federal Reserve stance that initially triggered a rebound to near $4,050 last week has morphed into a full-scale dollar retreat after Friday's weak NFP. The US Dollar Index tumbled, while the 10-year Treasury yield slid below key technical levels, eroding the opportunity cost of holding non-yielding bullion. Softer US data reinforces market bets that the Fed may pause its tightening cycle sooner than previously priced. This is traditionally a gold-positive environment, but the speed of the rally raises questions. The market now prices in a high probability of a rate hold in September, and any hawkish Fed speak could snap the dollar back, hitting gold hard.
Session Outlook
The American session on Sunday sees thinner liquidity with US markets closed, yet electronic gold trading continues and often amplifies volatility. The initial reaction to NFP is already priced in, so the question now is whether real money and institutional flows will chase price above $4,180. I expect a choppy range with an early bias to test minor resistance at $4,182.58, but without follow-through buying, a rotation lower toward $4,139.37 is equally plausible. The ATR(14) reading of $26.59 suggests a likely intra-session range between $4,138 and $4,191. Traders should keep an eye on any sudden DXY bounce or yield reversal — these will be the triggers for a sharp gold pullback.
Technical Analysis — Gold Price
Moving Average Structure
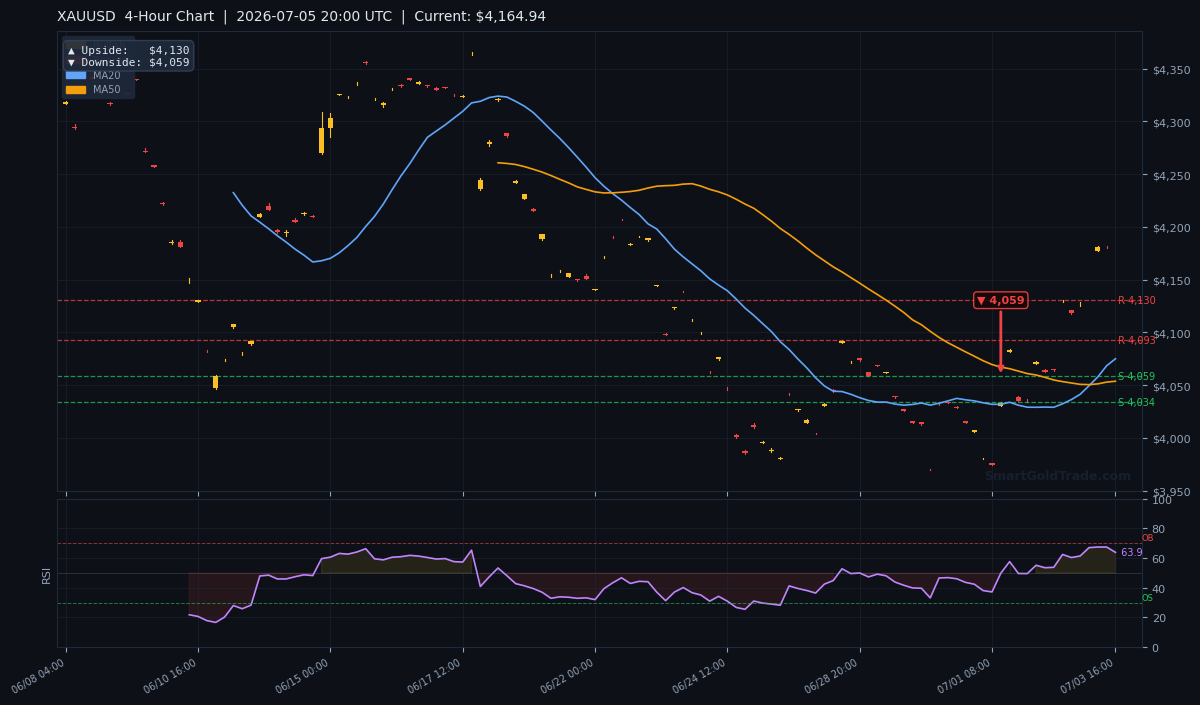
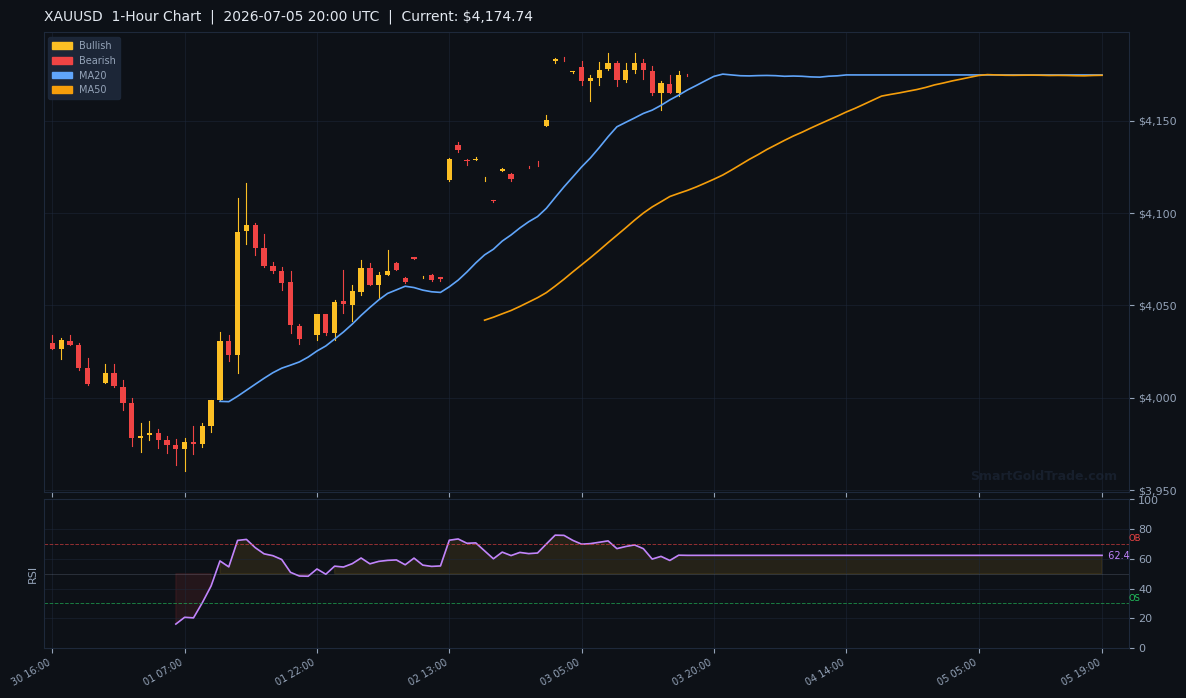
The short-term moving average setup is unequivocally bullish. The 20-period MA at $4,075.08 and the 50-period MA at $4,053.74 both sit well below current price, and the MA20 has crossed above the MA50, signaling a fresh bullish momentum phase. Gold is trading comfortably above both, which typically invites trend-following buyers. However, the long-term anchor remains bearish: the 200-day moving average rests at $4,293.43, comfortably above the market. This means the broader trend is still down from the yearly highs, and any rally that fails to reclaim the MA200 is a corrective bounce within a larger downtrend. Until gold closes a daily candle above $4,293, the structural bias leans risk-off for long-term positions.
RSI and Momentum
The 14-period Relative Strength Index reads 63.9, lodged firmly in neutral territory. It is neither overbought nor oversold, which means the market has room to run in either direction without immediate exhaustion signals. However, the RSI has not yet reached the 70 threshold that would accompany a strong breakout, suggesting that current upside is driven more by short-term news flow than by genuine momentum buying. If the RSI turns down from here without reaching overbought, it often signals a false breakout — exactly the kind of pattern that traps late longs before a reversal.
Key Price Levels
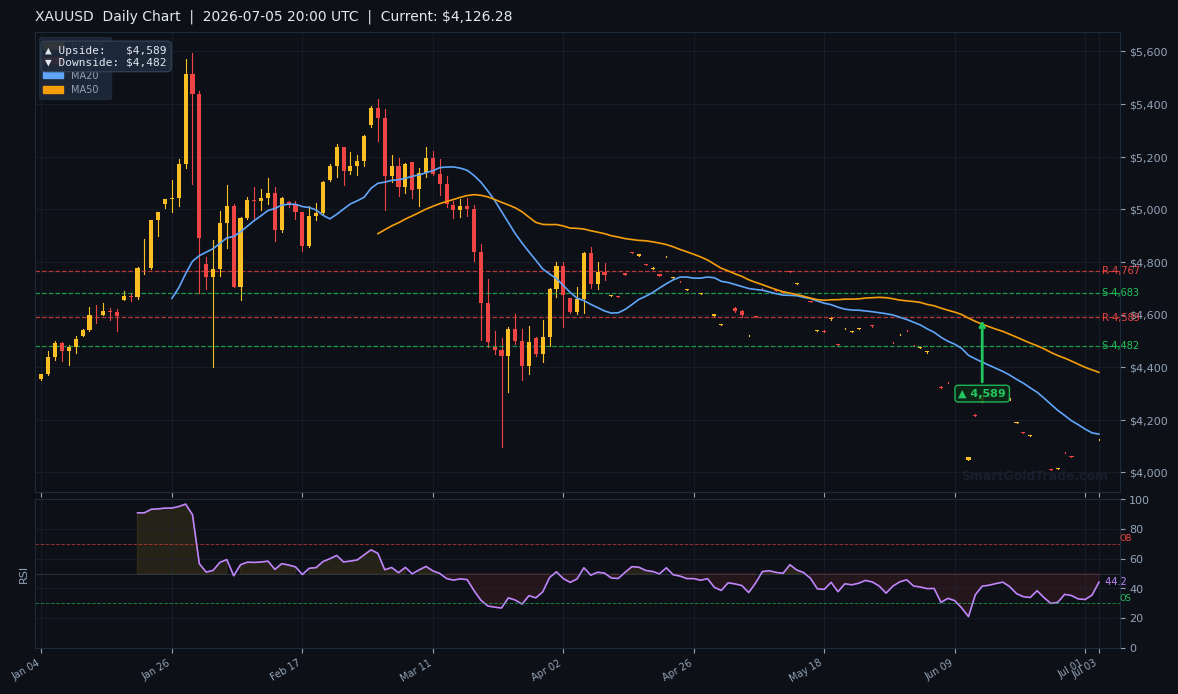
With price at $4,164.94, the battlefield is clearly defined. Immediate resistance is $4,182.58, which aligns with a prior swing high. A clean break above that exposes the next major resistance at $4,207.82. On the downside, $4,139.37 is the first line of defense, having previously acted as resistance and now expected to provide support. Below that, the stronger floor sits at $4,097.28. The ATR(14) of $26.59 frames today's expected range. The daily chart arrow points to an ultimate upside target of $4,589 and a downside target of $4,482, but those levels are weeks away.
| Timeframe | Trend | Resistance | Support | RSI |
|---|---|---|---|---|
| 1-Hour | Bullish | $4,182.58 | $4,139.37 | 63.9 |
| 4-Hour | Bullish | $4,207.82 | $4,097.28 | — |
| Daily | Bearish (below 200-MA) | $4,589 | $4,482 | — |
Fundamental Drivers
The primary catalyst is Friday's NFP undershoot, which validated the market's dovish Fed expectations and sent the dollar spiraling. The weak labor data came on top of a softer CPI print in June, building a narrative that the US economy is cooling fast. This has real implications for gold: lower rates and a weaker dollar are the twin engines of a precious metals rally. Yet the market is not a one-way street. Any hint of a strong ISM services print later this week or hawkish Fed minutes could quickly unwind these gains.
Geopolitically, tensions in Eastern Europe and the Middle East continue to simmer, but they have not escalated to the point of driving a new safe-haven bid. Crude oil prices edging higher may feed inflation fears and complicate the Fed's path, indirectly supporting gold. The Dollar Index trading near multi-week lows is the most immediate tailwind, but it is also vulnerable to a snap-back rally that would pressure XAU/USD.
Key Event to Watch
The most important scheduled release this week is the ISM Services PMI on Tuesday, July 7. If the index comes in above 52.5 — beating the consensus — it could revive rate-hike fears and strengthen the dollar, dealing a blow to the gold price. Conversely, a sub-50 reading would reinforce the slowdown narrative and potentially fuel a push above $4,207.82. Traders should also monitor any unscheduled Fed comments; a surprise hawkish remark from a voting member could be the spark for a sharp reversal.
Devil's Advocate — What Inverts the Bias
The bullish case hinges on the NFP momentum carrying gold through $4,182 toward $4,207. But several factors can invalidate this. First, gold remains below its 200-day moving average at $4,293.43, a fixture that institutional algorithms treat as a sell zone. Second, the rally has come on thin post-holiday volumes — a classic recipe for false breakouts. If the price fails to hold above $4,139.37 and descends through $4,097.28, the bullish thesis is broken. A daily close back below the MA20 at $4,075 would confirm a bull trap and expose the metal to a retest of the $4,050 area.
Trading Strategy for American Session
Given the contrarian setup, I favor a short bias with precise risk management. Aggressive traders can look to sell a failed test of $4,182.58 with a stop loss at $4,210, just above the $4,207.82 resistance. The first take-profit target is $4,140, followed by $4,100. This offers a risk-reward ratio better than 1:2. For those who prefer to wait for a breakdown, an entry below $4,139.37 on increasing volume would be the signal, with the same profit targets and a stop at $4,165. The ATR of $26.59 means a stop less than $30 away is realistic and provides a cushion against noise. If the price closes decisively above $4,207.82 on the 4-hour chart, the short thesis is void and a run toward the 200-day MA at $4,293 becomes probable.
For traders looking for Shariah-compliant exposure without leverage, halal gold trading on SmartGoldTrade allows direct ownership of physical gold with spot execution — a fair way to participate in moves like these while staying within Islamic principles.
Key Takeaways
- The gold price bounced to $4,164.94 after weak NFP, but resistance at $4,182.58 looms as a near-term hurdle.
- Short-term moving averages are bullish, with MA20 at $4,075.08 and MA50 at $4,053.74, yet the 200-day MA at $4,293.43 caps the longer trend.
- RSI at 63.9 shows neutral momentum — room to move either way without exhaustion signals.
- A break below $4,139.37 would shift control to the bears, targeting $4,097.28 next.
- ISM Services PMI on Tuesday is the next major risk event that could reverse or extend the NFP-driven rally.
- The expected session range based on ATR is $4,138 to $4,191; a breakout outside this zone signals strong directional intent.
Conclusion
The gold price stands at a crossroads this American session. The NFP-inspired push above $4,150 has invigorated the bulls, but the technical landscape warns of a trap. The rally is still subordinate to the 200-day moving average at $4,293.43, and price is testing a well-defined resistance band starting at $4,182.58. Without a fresh catalyst, the odds favor a fade. A swift rejection from resistance would target the $4,139 support, and a breakdown there flips the narrative from bullish to bearish. The week ahead will likely define whether this is the start of a deeper recovery or merely a short-covering pop that fizzles. For those who view the gold price through a long-term wealth lens, Shariah-compliant gold investment pools offer a way to build assets without getting caught up in daily swings.
FAQ
Why did the gold price spike after the NFP report?
The US Non-Farm Payrolls data on July 3 showed far fewer jobs added than expected, weakening the US dollar and lowering opportunity costs for holding gold. This triggered a sharp rally through the $4,150 level as traders priced in a more dovish Federal Reserve stance.
Is the gold price breakout sustainable?
The short-term momentum looks strong, but the gold price is still trading below the 200-day moving average at $4,293.43. Without a daily close above that level, the rally remains a corrective bounce within a broader downtrend, and thin post-holiday liquidity makes it vulnerable to false breakouts.
What are the key levels to watch this week?
Immediate resistance sits at $4,182.58, followed by $4,207.82. On the downside, $4,139.37 is the first support, with stronger buying interest around $4,097.28. A clear break of either boundary should set the tone for the next directional move.