Gold price is struggling near $4,219 on Thursday as the American session opens, with traders still weighing yesterday’s seismic Federal Reserve decision — the first under new Chair Kevin Warsh. The Dow Jones Industrial Average had notched its third straight record just hours earlier, but a distinctly hawkish hold sent the US dollar soaring and crushed the yellow metal through every major moving average in a matter of hours.
Now, with the critical $4,315 support cluster directly in the firing line, the remainder of today’s session will determine whether bears can deliver a conclusive breakdown or whether dip buyers stage a last-ditch recovery. Initial jobless claims due at 8:30 a.m. ET could briefly steady the ship, but the overarching trend has turned hostile for the gold price.
Gold Price Market Overview
Macro Context
The biggest macro shock overnight came from the Federal Reserve’s first policy decision under Chair Kevin Warsh. By holding rates steady but sharply revising the 2026 dot plot to a single 25-basis-point cut, the central bank delivered a far more restrictive message than markets had anticipated. The DXY rocketed to 104.55, its loftiest since late May, while the 10-year yield surged to 4.48%, creating a hostile environment for gold price. Geopolitical risks have not escalated enough to counter the dollar’s rally, leaving gold vulnerable.
Session Outlook
The American session will be driven by the market’s digestion of the Warsh narrative and the next round of US data. Initial jobless claims, due at 8:30 a.m. ET, are expected at 235K; a miss to the upside could briefly lift gold on recession fears, but the overarching USD strength is likely to cap any rally. Liquidity will peak during the New York overlap, with an expected intraday range of $27.20 based on the Average True Range. The battle zone is clearly defined: bears need a close below $4,315 to open the path to $4,200, while bulls must defend that level at all costs to avoid a breakdown.
Technical Analysis
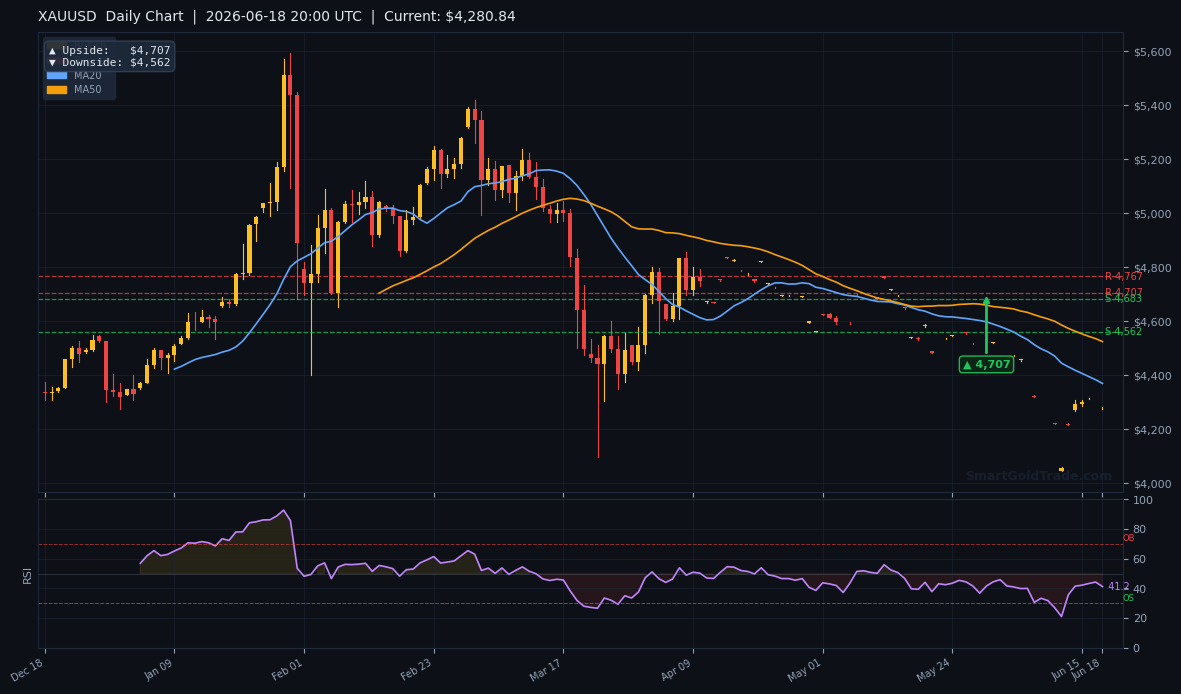
After yesterday’s plunge, XAU/USD is trading beneath all three major moving averages, a configuration that aligns with a strong bearish structure. The 20-period MA at $4,314.34, the 50-period MA at $4,257.09, and the 200-period MA at $4,481.69 all sit above the current price of $4,219.04, confirming that sellers remain in control. Yet the EMA structure reveals an intriguing nuance: the MA20 remains above the MA50, signaling a latent short-term bullish momentum that is at odds with the price action — a reminder that trend-following setups can trap both sides if not handled carefully.
Moving Average Structure
The daily moving average layout is decisively bearish. The MA20 at $4,314.34 acted as a pivot during the overnight flush; it now merges with the S1 support at $4,315.86 to form a formidable supply zone. The MA50 at $4,257.09 provides the next lower resistance, while the MA200 at $4,481.69 looms far above, underscoring how much ground gold has lost. A sustained move above the MA20 would be the first signal that the bearish momentum is stalling.
RSI and Momentum
The 14-period RSI stands at 41.4, firmly in neutral territory but tilting lower. There is no oversold reading yet, meaning the sell-off has room to extend before oscillators signal exhaustion. For the American session, this suggests that momentum traders may still have fuel to push price toward the $4,314–$4,315 support congestion, and a break below could accelerate the decline.
Key Price Levels
Support is concentrated at S1: $4,315.86 and S2: $4,315.62 — a rare double-bottom floor that, if pierced, would trigger a cascade of stop losses. Resistance tiers are set at R2: $4,365.61 and R1: $4,470.85, with the initial hurdle at the MA50 $4,257.09. The ATR of $27.20 implies that any intraday move exceeding this range should be considered unusual, adding weight to a breakout scenario should volatility expand.
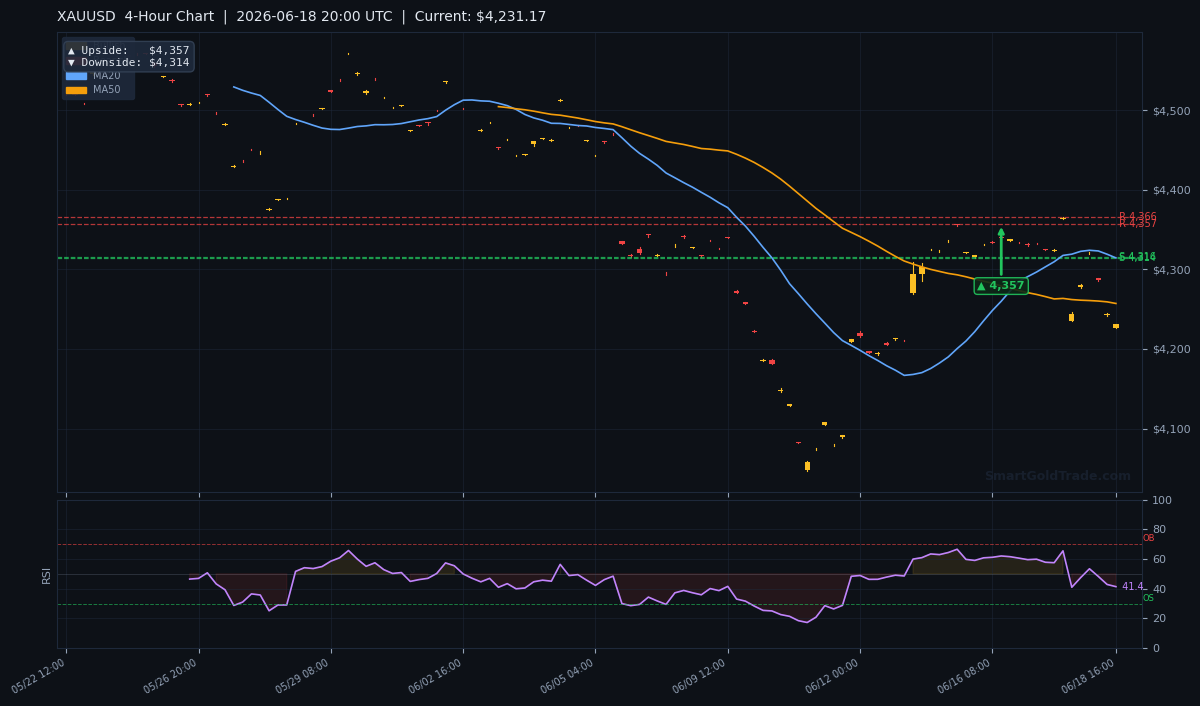
The 4-hour chart illuminates the breakdown sequence:
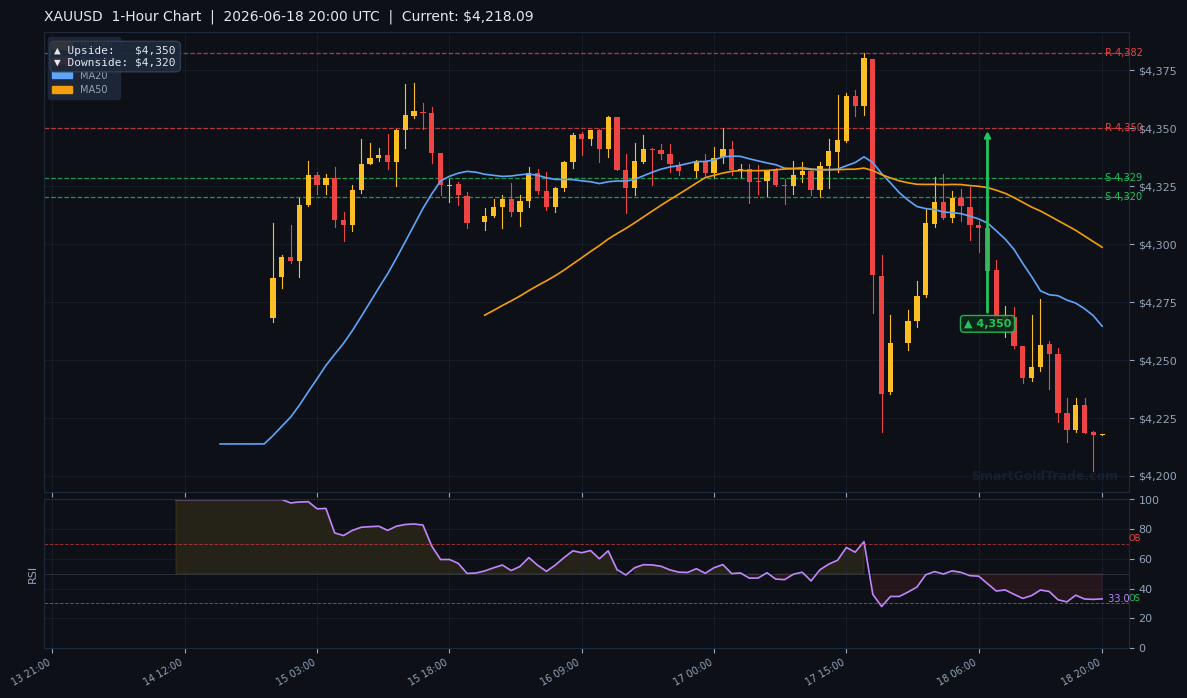
The 1-hour chart details the short-term resistance near $4,350 and downside target at $4,320:
Fundamental Drivers
Wednesday’s Federal Reserve meeting was the primary catalyst behind the gold price rout. Chair Warsh, in his inaugural post‑meeting press conference, emphasized that “the battle against inflation is not yet won” and that the committee will need to see a sustained cooling in core PCE before considering rate relief. This rhetoric echoed through the bond market, driving real yields higher and hammering zero-yield gold.
The DXY extended its rally into Thursday’s European hours, pressing against resistance at 104.60, while equity futures pointed to a lower open on Wall Street. The shift in rate expectations has upended the risk‑on carry that had propelled the Dow to new highs, and gold price has been swept up in the liquidation.
Key Event to Watch
Beyond the initial claims release, the next high‑impact event is Friday’s flash PMI readings for June. A composite PMI below 50 could rekindle slowdown fears and offer a temporary lifeline for gold, but any upside surprise in the services sector would reinforce the hawkish case and likely push XAU/USD below the critical $4,315 floor.
Devil’s Advocate
While the path of least resistance points lower, a sharp reversal is not off the table. If gold price manages to reclaim the MA20 at $4,314.34 and close a 4‑hour candle above the $4,315 resistance cluster, the bearish narrative would be invalidated. Such a move could trigger a short squeeze toward $4,365, the site of the next structural resistance. Additionally, if jobless claims surprise massively to the upside and raise recession odds, safe‑haven flows could momentarily overpower the dollar’s strength, giving bulls an opportunity to retake the initiative.
Trading Strategy for American Session
The most compelling setup remains a short on a pullback. With the dominant trend firmly bearish, I would look to sell into strength near the MA50, which comes in at $4,257.09. An entry zone between $4,255 and $4,260 provides a sensible risk‑reward, placing a stop loss at $4,321 — just above the double support level that could act as a reversal point if broken. The target is $4,200, a psychologically important round number that aligns with the 4‑hour downside arrow at $4,314 extended by the ATR of $27.20.
Aggressive traders who catch a fresh break below $4,315 on high volume could consider a momentum sell, trailing the stop tightly above the broken level. More conservative traders may opt to stand aside until after the claims data, as a spike toward $4,320 could provide a better entry. For those who prefer a systematic approach, professional gold trading signals can eliminate the guesswork by delivering real‑time alerts with exact levels. And for traders committed to ethical principles, interest‑free spot gold trading ensures compliance with Islamic finance by avoiding swaps and physical delivery of the metal. If you'd rather let professionals manage the trading entirely, mudarabah investment plans offer a Shariah-compliant profit-sharing approach starting at just $10.
Key Takeaways
- Gold price is under heavy pressure at $4,219, down sharply from yesterday’s Fed-induced selloff.
- The critical support floor at $4,315 held overnight but remains the session’s most important level.
- Warsh’s hawkish