Gold price jumped to $4,364.25 in early American trade, building on yesterday’s explosive 0.81% leap that pushed the gold price from a low of $4,306 to a close near $4,344. The catalyst: the surprise US-Iran deal that eases inflationary pressures, convincing traders to drastically reduce bets on a 2026 Federal Reserve rate hike. With core inflation fears cooling, the dollar and Treasury yields softened, handing gold a powerful tailwind.
That momentum is now colliding with technical resistance levels as the New York session gets underway. Bulls will try to print a decisive close above $4,364 while bears wait to see if the deal’s impact can truly derail the Fed’s tightening path. The next hours reveal whether the rally extends toward $4,442 or stalls out.
Gold Market Overview
Macro Context
The US Dollar Index (DXY) dropped 0.3% overnight, hovering near 101.5, while 10-year Treasury yields slipped below 4.10% for the first time in two weeks. That softer rate environment directly underpins the gold price, which thrives when the opportunity cost of holding non-yielding assets declines. The Iran agreement signals a potential easing of geopolitical tension that had driven crude oil higher and stoked supply-chain inflation.
However, the market’s rapid repricing — now assigning less than a 30% probability to a September hike — may be fragile. If upcoming data on retail sales or jobless claims surprise to the upside, the Fed could quickly recalibrate.
The move also underscores gold’s enduring safe-haven appeal — and why many investors complement their trading with physical gold products to hedge against currency debasement.
Session Outlook
The American session usually delivers the deepest liquidity and sharpest moves. Today, traders will watch the $4,364.25 open as a pivot; sustained trade above invites a test of $4,442.32, while failure to hold $4,315.86 would signal exhaustion. With no high-impact economic releases scheduled for today, the session may be driven by technical flows and residual news digestion, keeping volatility within the $4,315–$4,442 range unless an unexpected headline strikes.
Technical Analysis
Moving Average Structure
The moving average configuration paints a mixed short-term vs. long-term picture. The 20-period moving average sits at $4,317.46 and the 50-period MA at $4,263.43. With price holding above both, the short-to-medium trend is decidedly bullish — a classic “golden cross” zone where MA20 > MA50 amplifies momentum. However, the 200-period MA at $4,489.68 remains overhead, and price is still below that key gauge. That keeps the broader cycle bearish; gold must eclipse $4,489 to confirm a regime shift.
RSI and Momentum
The 14-period Relative Strength Index reads 65.5, squarely in the neutral-to-bullish band. It has not yet reached the overbought threshold of 70, meaning buying pressure could still accelerate without an imminent reversal. This position gives bulls a runway but also warns that a quick spike to 70 may coincide with resistance, creating a short-term top.
Key Price Levels
Support and resistance derived from the 4-hour chart show S1 at $4,442.32 and S2 at $4,315.86. Resistance looms at R1 $4,513.84 and R2 $4,470.85. The average true range (ATR) stands at $12.30, suggesting an expected intraday band of roughly $4,352 to $4,376 based on current price. A break of $4,442 would open the door to $4,470 and eventually $4,513. Conversely, a close below $4,315 turns the tide back toward the $4,263 MA50 support.
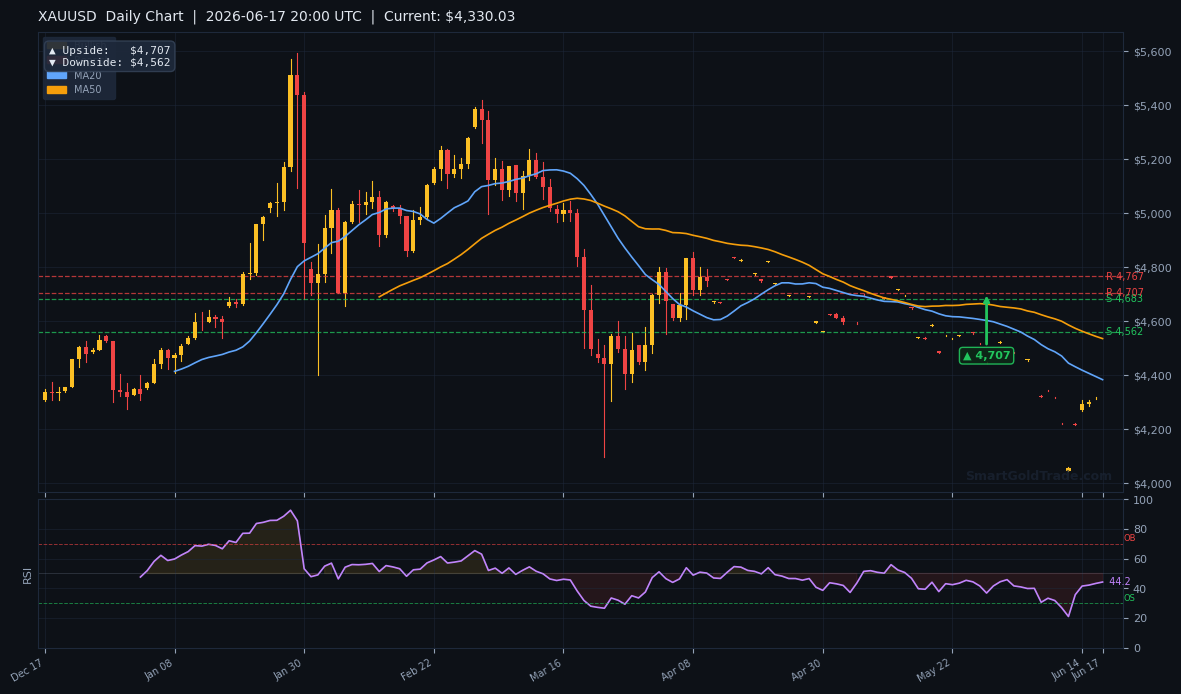
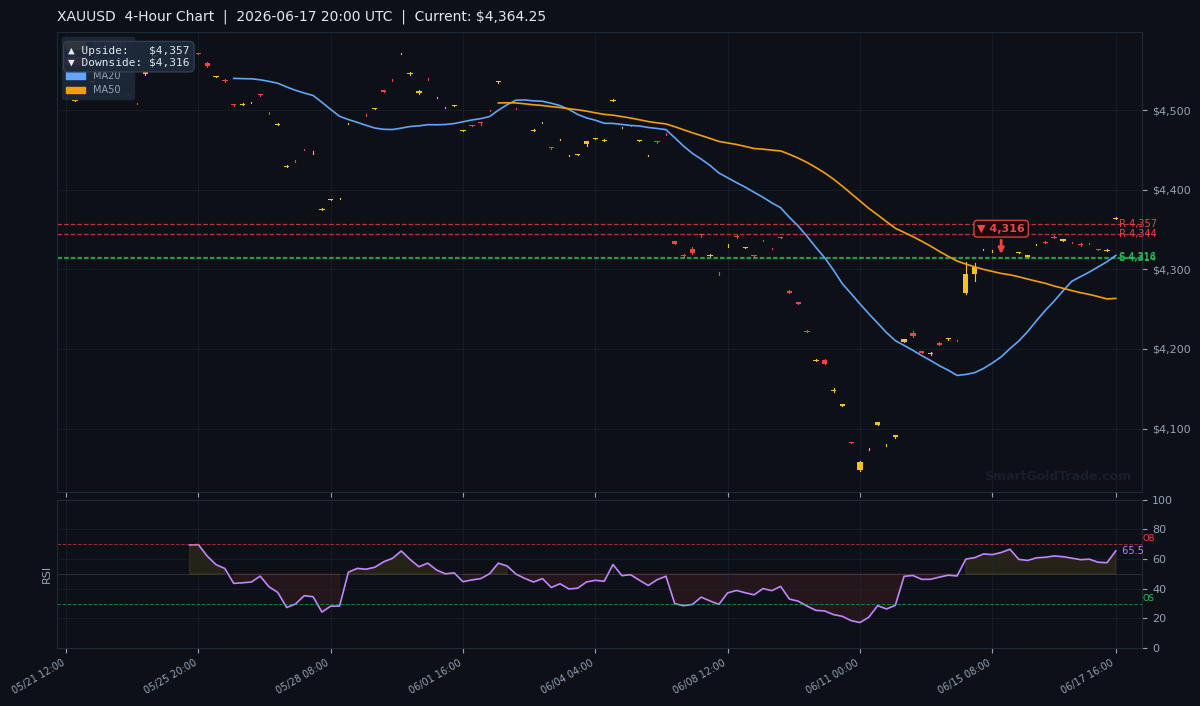
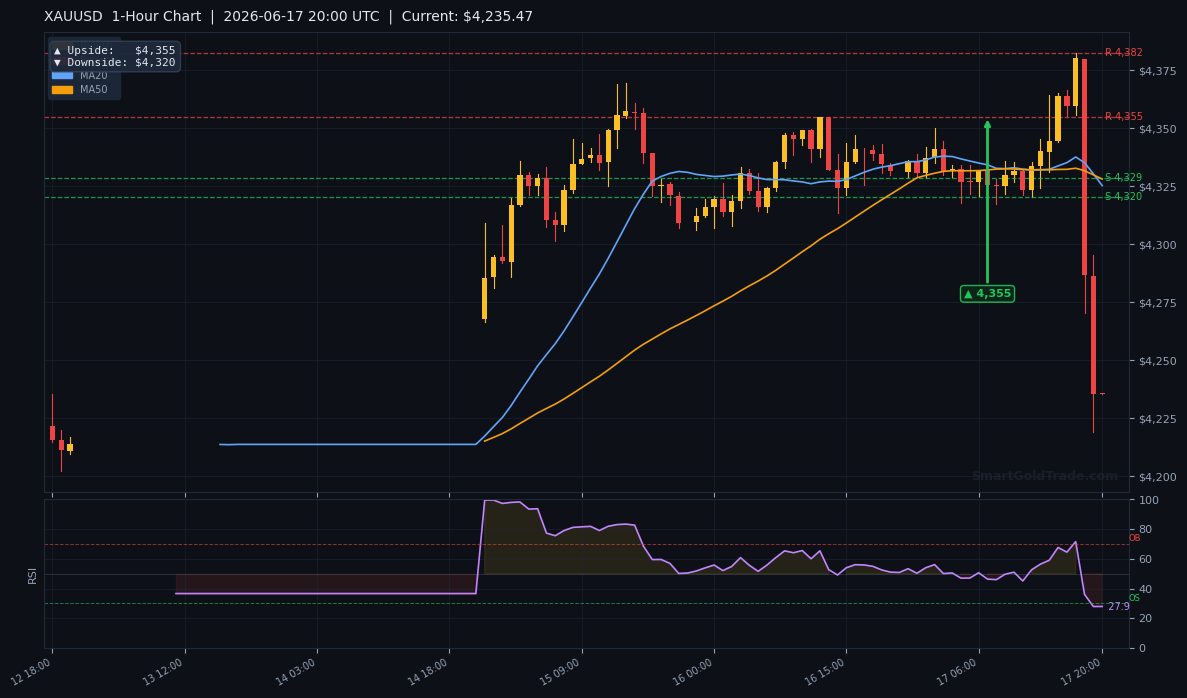
| Timeframe | Upside Target | Downside Target |
|---|---|---|
| Daily | $4,707 | $4,562 |
| 4-Hour | $4,357 | $4,316 |
| 1-Hour | $4,355 | $4,320 |
Fundamental Drivers
Yesterday’s US-Iran accord delivered the most potent gold catalyst in weeks. By winding back sanctions in exchange for nuclear compliance, the deal injected confidence that crude prices would stabilise and global supply-chain inflation would ebb.
Traders slashed the probability of a September Fed rate hike below 30%, triggering a pronounced drop in real yields. This dynamic is likely to dominate sentiment for days, though the market will quickly pivot if fresh evidence of sticky core inflation surfaces.
Central banks, including China and India, have been consistent net buyers of gold this year, adding further structural support to the gold price.
The dollar-gold inverse correlation has rarely been this sensitive. With DXY near 101.5, any bounce back above 102 could cap gold’s advance, while a break below 101.2 would supercharge the rally. Meanwhile, the CME FedWatch tool shows November now as the most likely window for any tightening restart — a shift that strips away near-term headwinds for the yellow metal.
Key Event to Watch
This week’s marquee event is Friday’s US retail sales report for May, released on June 20. A strong print could resurrect rate-hike expectations and pressure gold price, while a miss may fuel the current rally toward $4,489. Until then, the market will digest any Fed-speak for clues, but the Iran deal remains the dominant narrative.
Devil’s Advocate
The bullish argument breaks down if the gold price fails to hold $4,315.86 (S2). A daily close below that level would violate the short-term uptrend and likely trigger a retreat to $4,263.43 (MA50). Moreover, if the US-Iran deal details reveal that sanctions relief is gradual and inflation actually remains sticky, the Fed could quickly reverse its dovish posture, sending yields higher and gold lower.
A bearish reversal pattern on the 4-hour chart near $4,364 would be the early warning signal.
What the Gold Price Move Means for Halal Investors
Gold price rallies like this one aren't just for conventional traders — they open a powerful door for those observing Islamic finance principles. Because SmartGoldTrade’s spot trading is riba-free and backed by physical bullion, every pip in your favour translates into halal profit. Whether you’re a short-term trader capitalising on intraday swings or a long-term investor seeking stable wealth preservation, the current environment — with real yields declining and the dollar softening — is particularly favourable.
For those who prefer a hands-off approach, the platform’s musharakah pools and mudarabah plans allow you to share in the gold price appreciation without actively monitoring charts. When the gold price breaks key levels like $4,442, halal investors can adjust their exposures to capture the trend. The key is staying disciplined: use stop-losses aligned with the ATR and avoid leverage, which is prohibited anyway. With the metal above $4,300 and resistance levels clear, halal traders have a statistically sound backdrop to ride the trend higher.
Trading Strategy for American Session
Entry zone: Consider longs on a pullback to the $4,317–$4,316 area (MA20 and S2), with a tight stop below $4,305 (just under yesterday’s low). More aggressive traders might wait for a confirmed breakout above $4,442 to target $4,470 and $4,513. Shorts could be entertained on a rejection at $4,442 with a stop above $4,455 and a target back to $4,364 or $4,316.
Risk management: position size to a maximum 1% account risk per trade, respecting the $12.30 ATR as a volatility guide. Traders seeking precise entry and exit levels can follow professional gold trading signals that map these technical zones in real time. For those who prefer a fully Shariah-compliant approach, opening a spot gold position on a Shariah-compliant trading platform ensures you own physical bullion without swap charges.
Key Takeaways
- Gold price surged from a $4,306 low to $4,364.25 on the back of the US-Iran deal that cooled inflation fears and reduced rate-hike bets.
- MA20 ($4,317.46) is firmly above MA50 ($4,263.43), confirming a short-term bullish momentum structure.
- RSI at 65.5 is neutral-bullish, leaving room for further upside without immediate overbought risks.
- Resistance stacks at $4,442.32 (S1), $4,470.85 (R2), and $4,513.84 (R1); bulls need a decisive close above $4,442 to aim higher.
- Support critical at $4,315.86 (S2); a breakdown would expose the $4,263 MA50 and flip sentiment bearish.
- ATR of $12.30 suggests an American session range roughly bounded by $4,352 and $4,376 unless a catalyst widens volatility.
Conclusion
The American session inherits a lively but technically delicate setup. Gold price sits firmly on the bullish side of short-term moving averages, yet the 200-MA at $4,489.68 keeps the broader trend in bear territory. Today’s immediate battle line is $4,442; a break there re-targets $4,470 and $4,513. Failure to hold $4,315, however, would signal that the Iran-deal momentum has exhausted itself. As long as Friday’s retail sales risk hasn’t been resolved, every rally should be managed with tight stops and clear profit targets. The session’s direction will likely be set by whether the $4,306–$4,364 zone acts as a floor or a ceiling by the London close.
FAQ
- What is the gold price today?
- As of the American session on June 17, 2026, XAU/USD trades around $4,364.25, up sharply from yesterday’s low of $4,306.
- Why did gold price rise suddenly?
- The US-Iran nuclear deal eased inflation fears, causing traders to slash bets on a Federal Reserve rate hike in 2026. Softer yields and a weaker dollar propelled gold above $4,340.
- What is the next resistance level for gold?
- Immediate resistance sits at $4,442.32 (S1). A break higher targets $4,470.85 (R2) and then the pivotal $4,513.84 (R1).
Trading Gold (XAU/USD) carries significant risk of loss and is not suitable for all investors. This content is for informational purposes only and does not constitute financial advice. Always conduct your own research and trade responsibly.