Gold price opens Wednesday's Asian session at $4,324.52, barely budging after Tuesday's Bank of Japan meeting where Economy Minister Minoru Kiuchi pressed for closer government–central bank coordination on the 2% inflation target. The yen flickered but gold stayed flat — a textbook reaction in a market starved of fresh catalysts. Liquidity is razor-thin, and the chart whispers that a breakout is unlikely before London enters. This is a session for preparation, not impulse.
Knowing exactly where the floor and ceiling sit matters more than trying to force a trade in a vacuum.
Gold Price Market Overview
Macro Context
The dollar index is coasting near recent highs, while the 10-year U.S. Treasury yield holds steady above 4.4%, keeping a lid on aggressive gold upside. The Federal Reserve's higher-for-longer posture remains the gravitational force pulling the long-term trend lower. Still, gold price has carved out a short-term bid, supported by a MA20 above the MA50 and a neutral RSI that suggests no immediate exhaustion. Real yields haven't softened enough to fuel a sustained rally, so this recovery remains tentative.
Session Outlook
Asian hours will stay thin, with Tokyo digesting Tuesday's BoJ optics and no tier-one data on the calendar. Expect a $4,315–$4,340 range unless a headline crosses. Chasing price in low volume is a classic rookie mistake — spreads widen, fakeouts multiply, and stops get hunted. The smart play is to let the structure develop and react only when liquidity returns.
The Asian Session Trap: Why Patience Wins
Trading gold price during Asian hours can feel like watching paint dry — and that's exactly why smart traders step back. With Tokyo and Sydney providing the bulk of the flow, volumes are notoriously thin, spreads widen, and stop hunts become more common. Market makers often push price just enough to trigger resting orders before snapping back, leaving impulsive traders on the wrong side.
When the ATR is $19.05 and the usual intraday range is $20–$25, a sudden $8 spike can seem like a breakout. In low liquidity, it rarely sticks. The better approach is to map out critical levels and wait for London's volume to validate the direction. That patience preserves capital and keeps your head clear for the real opportunities.
Technical Analysis
Moving Average Structure
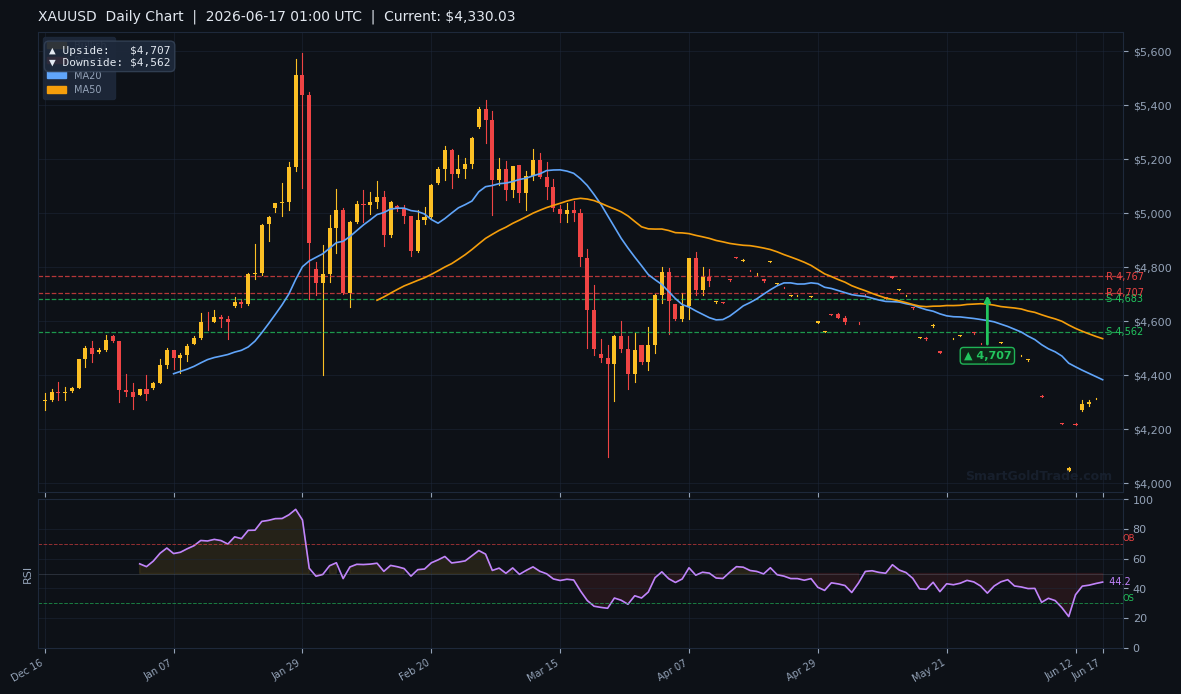
The 20-period moving average sits at $4,290.79, and the 50-period at $4,270.64. With price comfortably above both and the MA20 crossing the MA50 from below, the short-to-medium-term structure leans bullish. The 200-period average, however, looms at $4,494.98, well above current levels. That places gold in a tactical bull phase inside a strategic bear channel — a classic recipe for sharp two-way moves.
RSI and Momentum
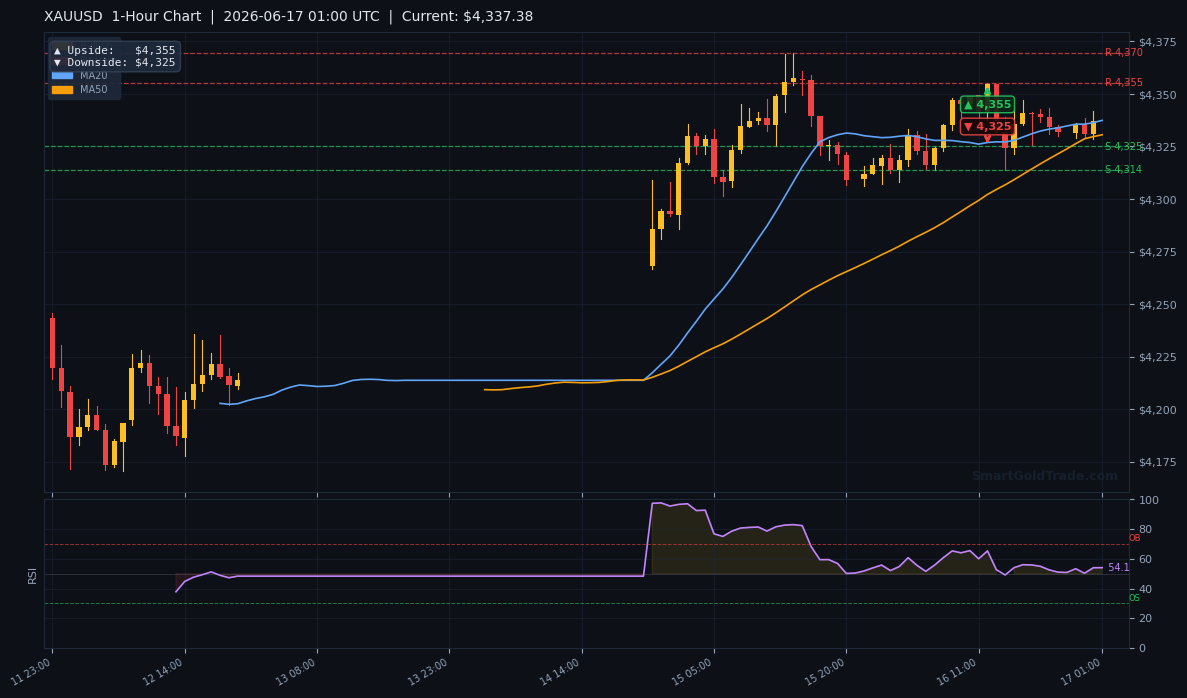
The 14-period RSI registers 59.6, squarely in neutral territory. It's not flashing overbought, so bulls still have room to press. But the reading also lacks the conviction of a momentum breakout. Price needs a catalyst to shove RSI above 65, which would signal a genuine push toward the $4,442 resistance zone.
Using ATR to Set Realistic Stops and Targets
The 14-period Average True Range (ATR) of $19.05 tells us the typical daily movement is roughly 19 dollars. Instead of guessing where to place stops, you can anchor them one ATR below your entry — that gives price room to breathe without invalidating the structure. If you're eyeing a long from the $4,325 area, a stop at $4,306 (approx. 1 ATR) or $4,312 (slightly tighter) makes sense against the $4,315.86 support floor.
On the profit side, the ATR also sets a realistic scaling horizon. With resistance at $4,442, that's a $117 rally from $4,325 — nearly six times the daily ATR. Expecting that move in one session is ambitious, but if London momentum carries through, partial profit-taking near $4,380 (half the distance) is a practical way to lock in gains while leaving a runner for the full target.
Key Price Levels
The chart defines immediate resistance at $4,442.32 (former support flipped) and $4,470.85, with a higher hurdle at $4,513.84. On the downside, $4,315.86 is the critical floor — a break below would open the door to $4,290 and possibly $4,270. The 14-period ATR of $19.05 sets the expected daily volatility band, giving traders a realistic frame for stop placement and profit targets.
| Timeframe | Upside Target | Downside Target |
|---|---|---|
| Daily | $4,707 | $4,562 |
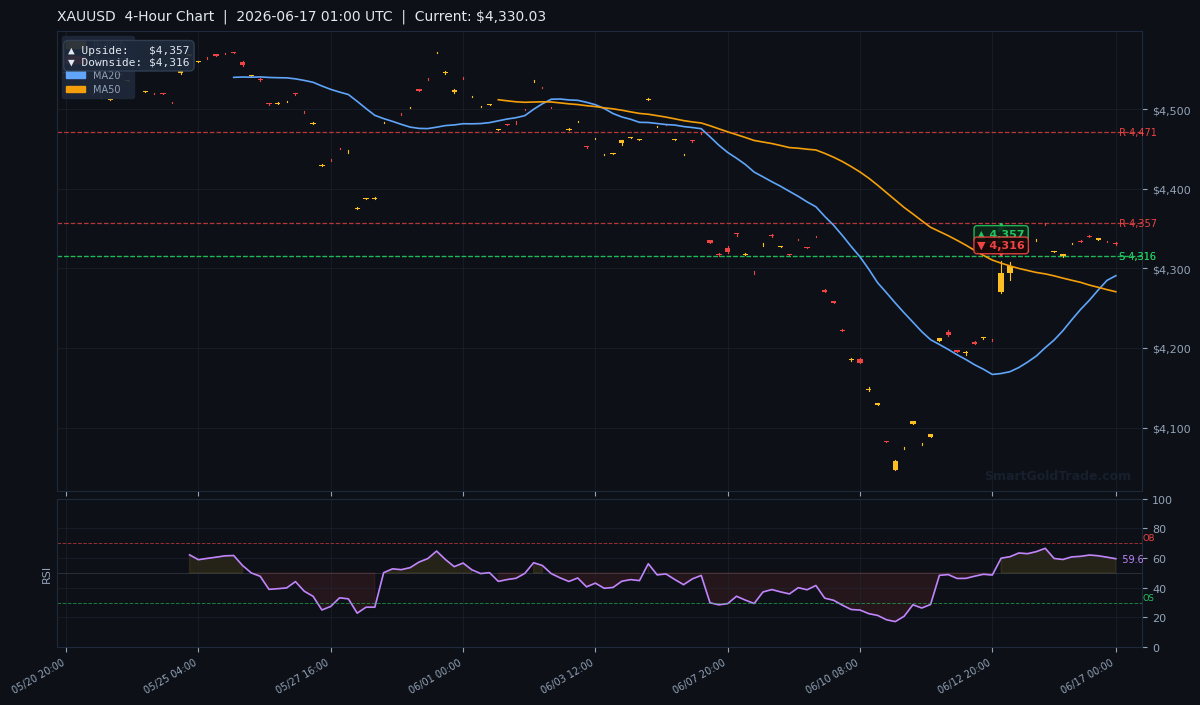
| 4-Hour | $4,357 | $4,316 |
| 1-Hour | $4,355 | $4,325 |
Fundamental Drivers
Tuesday's Bank of Japan gathering added a mild geopolitical texture after Economy Minister Kiuchi attended and urged “communication and collaboration” to sustainably hit the 2% inflation target. The yen's brief dip did little to shake gold, confirming that U.S. monetary policy still dominates the metal's pulse. With the Fed on hold and no speeches scheduled today, markets are left to digest the bigger picture: sticky inflation, resilient labour data, and a dollar that refuses to weaken. No fresh headlines means gold price will likely drift until Thursday's data.
Key Event to Watch
Thursday's U.S. initial jobless claims will be the first real test this week. A print below 230,000 would reinforce the “no cut” narrative and could drag gold price back toward $4,315, a move of less than one ATR from current levels. A surprise jump, however, might give bulls the excuse to test $4,442 ahead of the weekend. For now, the Asian session offers no edge — just a holding pattern.
Devil's Advocate
The bullish argument runs into trouble if gold price slips below $4,315.86 on a daily closing basis. That would snap the short-term MA support and expose the $4,290 region, where the 20-period moving average sits. A confirmed break would flip the tactical bias bearish and put the $4,200 handle back on the radar. Likewise, a hawkish surprise from Fed speakers later this week could vault the dollar and crush the current recovery before it reaches $4,442. And keep in mind that gold price remains below its 200-day moving average at $4,494.98 — the long-term trend isn't convincingly turned yet, so sellers still have the upper hand on the weekly chart.
Trading Strategy for Asian Session
I'm watching a potential long entry on a pullback to the $4,320–$4,325 zone, just above the $4,315.86 support floor. The stop goes at $4,306 — roughly one full ATR below entry — respecting the structural low while giving the trade breathing room against Asian noise. First upside target remains $4,442, and a break above opens $4,470.
If price drifts sideways, let it; no new positions should be initiated on a spike into resistance during thin volume. For traders who want an extra layer of confirmation, professional gold trading signals can complement your own chart work — especially when the session feels too quiet to trust your read alone.
Shariah-Compliant Gold Trading: Halal Strategies for Gold Price Moves
Many Muslim investors want to benefit from gold price fluctuations without engaging in riba (interest) or excessive speculation. Conventional CFD or leveraged accounts charge overnight swaps, which are not Shariah-compliant. SmartGoldTrade's halal gold trading platform solves this by offering spot gold trading with physical ownership — no leverage, no interest, and full transparency. You trade the real asset, earning from price movements in a fully Islamic manner.
If you'd rather hold tangible metal as a long-term store of value, you can purchase physical gold coins and bars directly. Watching the gold price climb while holding a 24K bar in your hand brings a peace of mind that digital contracts simply can't match. Whether you trade or hold, aligning your strategy with Islamic principles doesn't mean missing out on the gold market.
Key Takeaways
- Gold price is holding near $4,324.52 in a low-volume Asian session with no tier-one data on deck.
- Short-term bias leans bullish: price above MA20 ($4,290.79) and MA50 ($4,270.64), but below MA200 ($4,494.98).
- Key resistance stands at $4,442.32; a clean break targets $4,470.85 and $4,513.84.
- Critical support is $4,315.86 — a daily close below would invalidate the bullish setup.
- ATR of $19.05 suggests a realistic daily range of $20–$25, helping to calibrate stops and targets.
- Thursday's U.S. jobless claims are the next major volatility trigger that could decide direction.
- Halal gold trading and physical ownership offer Shariah-compliant ways to act on gold price moves.
Conclusion
Gold price is navigating a familiar Asian session — calm, bounded, and liquidity-dry. The short-term chart gives bulls a tentative edge, but the $4,442 hurdle must be cleared before calling this a recovery. Until then, the $4,315–$4,340 range is the realistic playground. Jumping the gun in thin conditions rarely pays; waiting for London to confirm the move does. Keep your plan tight, your risk tighter, and let the market come to you.
Frequently Asked Questions
- What is the gold price right now?
- As of the Asian session on June 17, gold price is trading near $4,324.52, consolidating after Tuesday's Bank of Japan meeting headlines.
- Where is the next resistance for gold?
- The immediate resistance sits at $4,442.32, followed by $4,470.85 and a stronger zone at $4,513.84.
- What support level should traders watch most closely?
- $4,315.86 is the line in the sand. A break below would expose the $4,290 area and potentially $4,270.
Risk Disclaimer: Trading Gold (XAU/USD) carries significant risk of loss and is not suitable for all investors. This content is for informational purposes only and does not constitute financial advice. Always conduct your own research and trade responsibly.