Gold price is testing the $4,344 ceiling this European morning, with the XAU/USD pair trading at $4,323.69 after a muted Asian session. This morning’s Bank of Japan decision kept rates unchanged but signalled a more hawkish tone later in 2026, sending the yen higher and the dollar slightly lower. The cross wind gave gold enough lift to approach the first key hurdle. Last week’s US CPI print on June 12 showed core inflation edging down to 3.2%, yet Federal Reserve speakers remain cautious about the timing of a first rate cut. As London desks return from the weekend break, the question is whether bulls can convert this tentative push into a clean break above $4,344 or whether sellers will defend the zone and force a retest of $4,316 support.
Gold Market Overview
Macro Context
The Dollar Index is hovering near 102.30, while the 10-year US Treasury yield sits at 4.35%. Neither is giving a decisive directional cue, but the gradual softening of the greenback since last Thursday’s inflation data keeps a mild bid under gold. The Fed’s dot plot still implies only one rate cut this year, but markets are pricing a slightly better chance of a move in July. Traders are balancing that with resilient US labour data, leaving gold price sensitive to every incoming data point. Geopolitical risk provides a floor: the unresolved tensions in the Middle East and renewed sanctions chatter on energy exports keep haven demand alive, though no single headline has escalated enough to trigger a spike.
Session Outlook
The European session typically brings deeper liquidity and more conviction after the Asian lull. With London open, the gold price range is likely to settle between $4,316 and $4,355. A sustained push above $4,344 would invite algorithmic buying and target the $4,355 1‑hour pivot. Failure to hold $4,316 would expose the bullish short‑term structure to a corrective flush toward $4,268–$4,270, where the 50‑period moving average sits. The main trigger this morning is whether the BoJ commentary continues to damage USD/JPY, dragging the broad dollar lower and giving gold an indirect tailwind.
Gold Price Technical Analysis
Moving Average Structure
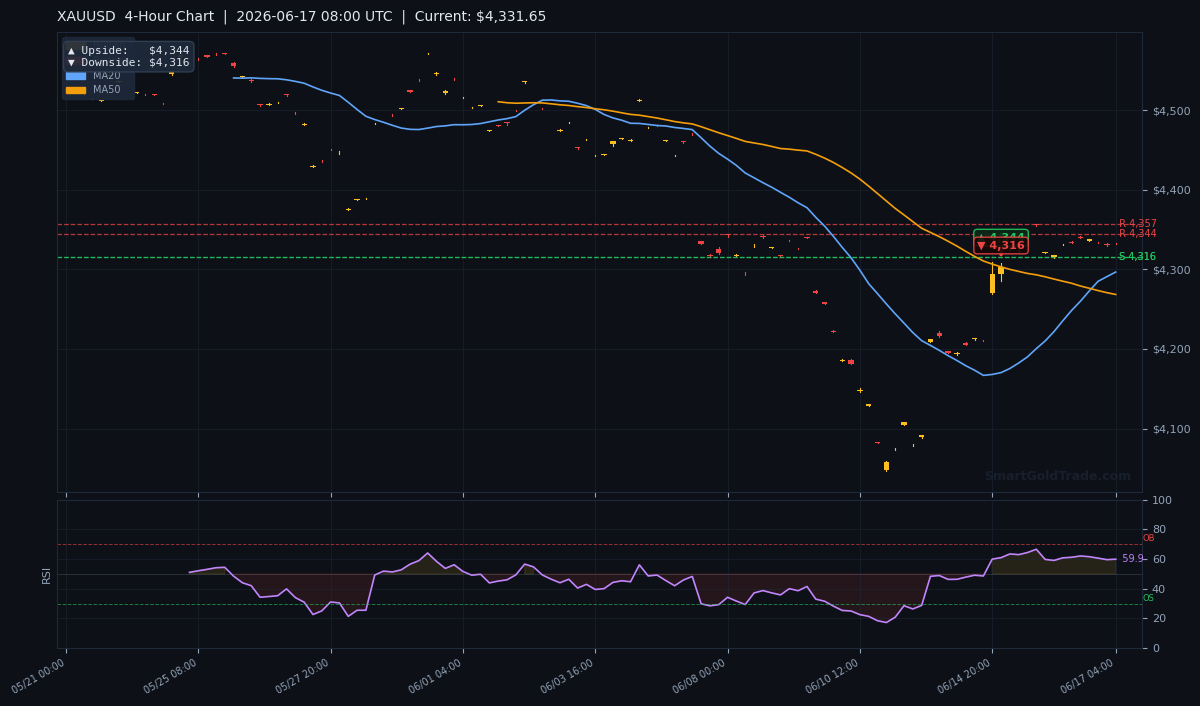
The 20‑period moving average on the H4 chart reads $4,296.56, and the 50‑period MA is $4,268.41. With the gold price at $4,323.69, XAU/USD trades above both, confirming a short‑term bullish momentum that has been building since early last week. The 200‑period MA at $4,493.57 looms far above, signalling that the broader trend remains in bear territory despite the recent recovery. The EMA alignment – MA20 above MA50 – supports a “buy the dip” mindset for intraday traders until the structure breaks.
RSI and Momentum
The 14‑period Relative Strength Index stands at 59.9, squarely in neutral territory but leaning toward overbought. It has not yet breached the 70 threshold, meaning there is still room for an extension before the market becomes technically stretched. Traders should watch for a move above 64 on the RSI to confirm a breakout above $4,344, while a dip below 50 would shift the short‑term bias back to neutral‑bearish and weigh on the gold price.
Key Price Levels
Support levels are marked at $4,315.86 (S2) and $4,442.32 (S1). Because the current gold price sits beneath S1, that level acts as overhead resistance until reclaimed. Resistance levels are $4,470.85 (R2) and $4,513.84 (R1). The Average True Range (ATR) over 14 periods is $12.15, implying a typical session range of $24–$30, which comfortably covers the space between $4,316 and $4,355.
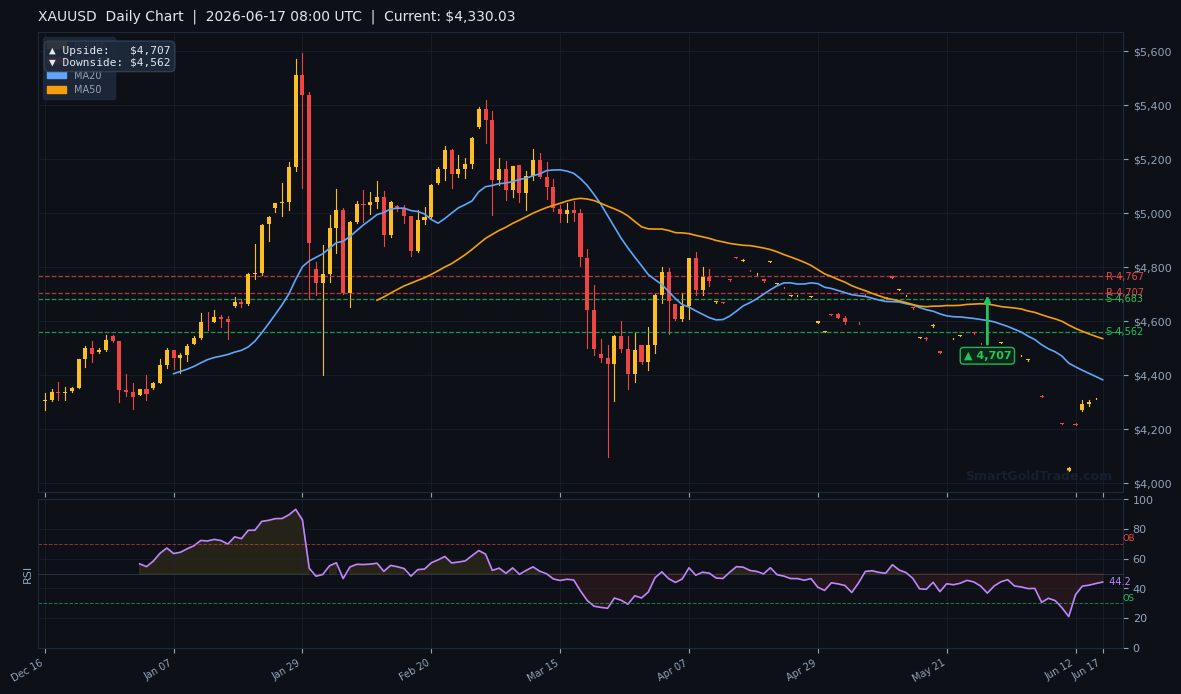
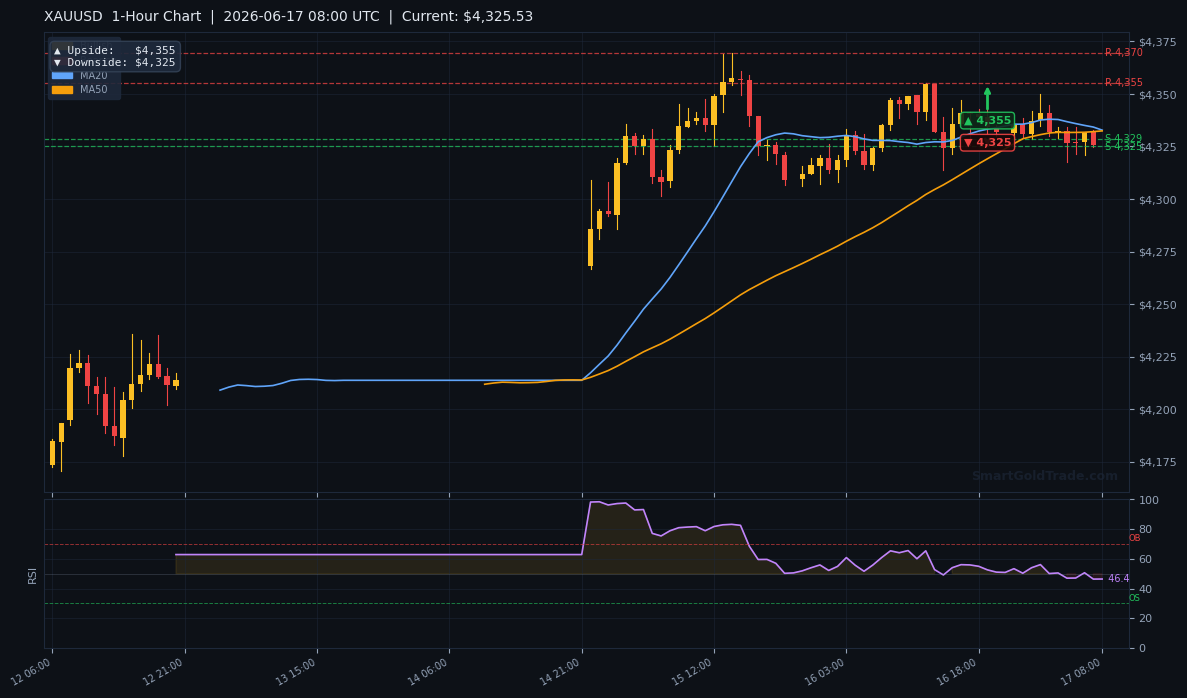
On the 1‑hour frame, price targets sharpen: the upside pivot sits at $4,355 and the downside at $4,325. The tighter range suggests the market is coiling, and a break of either side should generate a quick 15–20 point move. With the H4 chart showing a sequence of higher lows, bulls will target a measured move toward the daily upside target at $4,707 if the structural resistance zone is cracked.
Fundamental Drivers
The standout driver this morning is the Bank of Japan’s policy decision, which kept the short‑term rate target at 0.25% but updated its outlook with a hawkish bias. The yen strengthened across the board, nudging USD/JPY down to 160.25 and weakening the broader dollar. Gold, being priced in dollars, caught a modest bid. While the move is not seismic, it sets a constructive tone for the European open. Earlier this month, the June 12 US CPI release showed core inflation easing to 3.2%, but the market reaction was muted as the Fed maintained its data‑dependent stance. Geopolitical risk in the Gulf remains elevated after last month’s US maritime strike, though oil prices have stabilised and gold has not seen a fresh geopolitical spike.
Key Event to Watch
The single most important upcoming event this week is Wednesday’s US housing starts and building permits data, due on June 18. A strong print could temporarily lift the dollar and pressure gold price back toward $4,316. Conversely, a sharp miss would reinforce the rate‑cut narrative and likely propel gold through $4,355, opening the door to the 4‑hour resistance at $4,470. Traders should also monitor any unscheduled Fed commentary; the quiet period ends later this week, and any hawkish remarks could quickly reverse the dollar’s softness.
Devil's Advocate
The bullish case for the gold price collapses if it cannot hold $4,316 on a closing basis. The MA20 at $4,296.56 would then come under direct pressure, and a break below there would flip the short‑term EMA alignment back to neutral, inviting a test of the 50‑period MA at $4,268. A daily close under $4,268 would signal that last week’s rebound was a false start, and the broader bearish trend would re‑assert itself. The reversal level that matters most is $4,315.86 – if price spends more than an hour beneath it, stop‑losses from late longs will be triggered and a swift 30‑point flush toward $4,285 becomes plausible.
Trading Strategy for European Session
Given the short‑term bullish structure and RSI room to run, a long entry zone between $4,320 and $4,325 offers a favourable risk‑reward profile. Place a stop‑loss at $4,308, which sits just below the S2 support and the ATR noise band. The first take‑profit target is $4,344, aligning with the pivot that has capped price all morning. A break above that shifts the target to $4,355, the 1‑hour upside marker, with a possible extension to $4,370 if momentum accelerates.
For traders who prefer to wait for confirmation, a break‑and‑retest of $4,344 as support provides a second entry with a tighter stop around $4,334 and the same targets. To stay nimble, complement these levels with professional gold trading signals that deliver exact entries and exits in real time. Those wanting a hands‑off approach can consider copy trading top‑performing gold traders, while traders seeking a riba‑free environment can open an account through our halal gold trading platform that offers physical ownership and zero leverage.
Key Takeaways
- Gold price stands at $4,323.69, immediately below the $4,344 pivot that must break for upside acceleration.
- Short‑term moving averages are bullish: MA20 at $4,296.56 and MA50 at $4,268.41 both beneath price.
- RSI at 59.9 leaves headroom before overbought conditions appear, favouring dip‑buying until proven otherwise.
- Critical support at $4,315.86 must hold; a daily close below would flip the bias bearish toward $4,268.
- Resistance layers sit at $4,470.85 and $4,513.84, with a daily upside target at $4,707 if the trend matures.
- Wednesday’s US housing data is this week’s main event risk, capable of triggering a 40‑point swing in either direction.
Conclusion
Gold price faces a pivotal moment as the European session picks up steam. The short‑term bullish structure, anchored by a rising MA20 and a neutral‑to‑constructive RSI, points toward a test of $4,344. A clean break above that level targets $4,355 and possibly $4,470 in the next 48 hours. However, the broader bearish context – price still trades below the 200‑period MA at $4,493 – demands caution. The line in the sand is $4,315.86; a slip beneath it would unravel the recovery and expose the $4,268 floor. Until then, the path of least resistance is higher, but only a confirmed break of $4,344 will turn cautious optimism into committed buying.
Frequently Asked Questions
- What is the gold price right now?
- As of 08:00 UTC on June 17, 2026, gold price is $4,323.69 per troy ounce.
- What are the key support and resistance levels today?
- Key support is $4,315.86 (S2) and $4,442.32 (S1, acting as overhead). Resistance stands at $4,470.85 (R2) and $4,513.84 (R1). The intraday range is expected between $4,316 and $4,355.
- Is gold a buy today?
- The short‑term structure favours longs above $4,316, with an entry zone near $4,320–$4,325 and targets at $4,344 and $4,355. A drop below $4,308 would negate the bullish bias.
- What economic events could move gold this week?
- The main event is US housing starts and building permits on June 18. A strong reading could pressure gold toward $4,316, while a weak print may lift it toward $4,470. Fed commentary later in the week will also be closely watched.
Risk Disclaimer: Trading Gold (XAU/USD) carries significant risk of loss and is not suitable for all investors. This content is for informational purposes only and does not constitute financial advice. Always conduct your own research and trade responsibly.