
The gold price is holding at $4,555.56 this morning, stabilising just above the 20‑period and 50‑period moving averages after a subdued US holiday session. Monday’s trading was anaemic — Memorial Day shut US markets, and even the news of potential US‑Iran deal progress barely moved the metal beyond a quick probe above $4,550. Now Asian traders are stepping into a vacuum of liquidity, and the technical picture suggests bulls have a narrow window to push toward $4,570 before resistance thickens. The calm carries opportunity, but only for those who respect the thin‑volume rules.
We are watching a session where every pip counts, and false breaks are the default, not the exception. The macroeconomic backdrop — stable Treasury yields, a dollar that refuses to slide further, and a Federal Reserve that remains on pause — leaves gold without a strong directional catalyst. That shifts the burden onto technical structure, and right now the charts are whispering, not shouting.
Gold Market Overview
Macro Context
The US‑Iran negotiation story that briefly flashed on Monday failed to ignite any sustained move. A potential deal would erode geopolitical risk premia, yet gold never broke below $4,540, signaling that the larger market has already priced out most of the Middle East fear bid. With the DXY stuck near neutral levels and the 10‑year Treasury yield holding steady, gold is waiting for a fresh impulse — and that impulse likely won’t arrive during Asian hours.
Last week’s FOMC minutes confirmed the committee’s preference for watching data rather than cutting early, a stance that keeps the rate‑cut premium in gold capped. Meanwhile, the dollar’s inability to climb back above 100 gives gold a floor, creating a range‑bound environment that demands precision from intraday traders.
Session Outlook
Tuesday’s Asian session will be characterised by low participation — Tokyo is open, but Chinese and Australian desks are still digesting the extended weekend. Expect the gold price to trade within a $10–$12 corridor, heavily influenced by the early London futures fix around 08:00 UTC. Breakouts ahead of that window should be treated with suspicion; they are often liquidity probes rather than genuine directional signals.
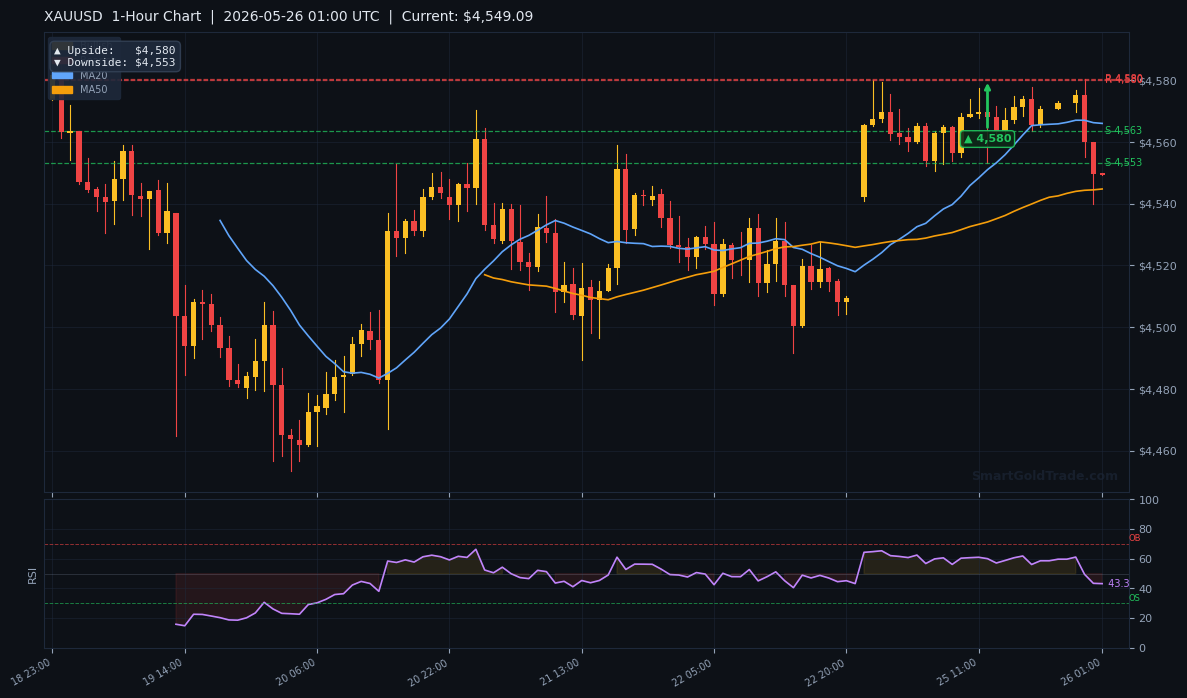
Key triggers are scarce on the calendar, so the session will be driven by order‑flow dynamics. If the $4,555 level holds through the first two hours, a slow grind toward $4,570 becomes the base case. A failure below $4,553 would open the door to the $4,542 demand zone.
Technical Analysis
Moving Average Structure
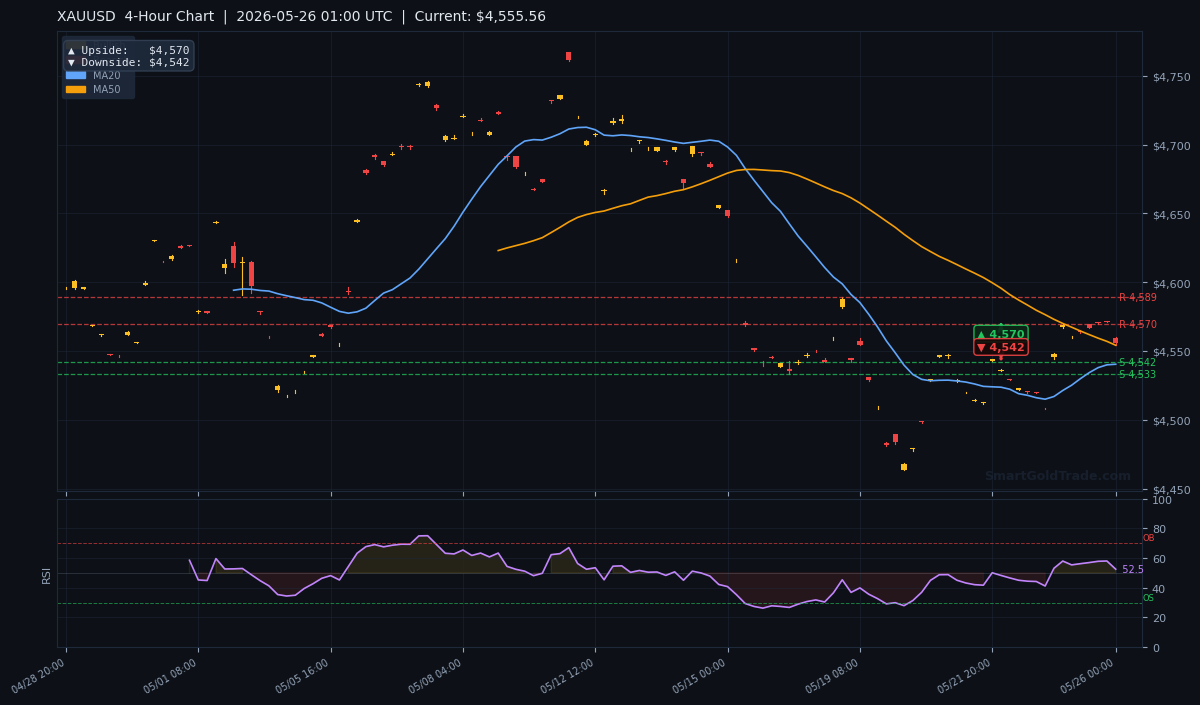
Right now XAUUSD is perched delicately above two key moving averages. The MA20 sits at $4,540.37, while the MA50 is at $4,554.16. Price is above both — a short‑term bullish signal — but the MA20 remains below the MA50, meaning the crossover has not yet turned positive. This MA20 < MA50 configuration typically reflects tentative buying; momentum is favouring the upside, but the medium‑term trend lacks conviction.
The MA200 at $4,664.84 is still far overhead, confirming that the broader structure remains bear territory. Any rally must clear not only $4,570 but eventually prove itself against that massive trend magnet, which makes $4,664–$4,700 a defining battleground over the medium term.
RSI and Momentum
The 14‑period RSI reads 52.5, floating in the neutral band with no divergence warning. This reading gives bulls breathing room — it is far from overbought, meaning the market can absorb further upside without immediate exhaustion. A push toward $4,570 would likely carry the RSI toward 60‑ish, still safe territory.
However, the absence of an oversold flag also means dip‑buyers need a clearer signal before committing aggressively. If the RSI breaks below 50.0 on the 4‑hour chart, it would align with a loss of the $4,553 pivot, shifting momentum back to sellers.
Key Price Levels
Our model’s pivot points place Resistance 1 at $4,721.37 and Resistance 2 at $4,699.28, while Support 1 stands at $4,695.39 and Support 2 at $4,667.98. Admittedly, these levels sit well above current price, reflecting the daily computation’s wider range. For the Asian session, the actionable boundaries are tighter: the $4,570 (4‑hour arrow target) and $4,580 (1‑hour arrow target) mark near‑term resistance, while $4,553 (1‑hour downside) and $4,542 (4‑hour downside) are the support floor.
The ATR(14) of $10.31 translates to an expected daily range of roughly $31–$35, so a move from $4,542 to $4,570 would be a tidy, realistic swing. Traders should respect these levels as intraday anchors.
Fundamental Drivers
The US‑Iran deal hopes that circulated yesterday briefly sapped safe‑haven demand, but the gold price absorbed the headline without breaking $4,540. That resilience suggests the market has already discounted a lessening of geopolitical risk in the Middle East. Attention is shifting back to the Federal Reserve and the dollar’s sluggish posture.
With the DXY unable to reclaim the 100.5 level and US real yields still negative at the short end, the fundamental floor under gold remains intact. The risk to the immediate outlook is a sudden hawkish comment from a Fed official — but with Fedspeak scarce until Friday, that risk is pushed to the back burner for Asian traders.
Key Event to Watch
This week’s dominant catalyst will be the US Durable Goods Orders report on Friday. A strong print could revive the “higher‑for‑longer” narrative and pressure gold toward the $4,667 daily support. A weak number, conversely, would feed rate‑cut hopes and likely propel XAUUSD toward the $4,838 daily upside target. Until then, the gold price is likely to stay range‑bound, favouring technically driven scalping strategies over swing positioning.
Devil’s Advocate
A break below the $4,553 pivot — the 1‑hour downside — would invalidate the short‑term bullish bias. That level aligns closely with the $4,553 value from the indicator arrow and would also drag the price under the MA50 ($4,554.16), turning the moving average cluster into resistance. If that scenario unfolds, expect a swift trip to $4,542 and possibly a deeper retracement toward the $4,667–$4,695 support band on the daily chart.
The chief wildcard is a sudden liquidity vacuum that triggers a stop‑run below $4,540 — a move that could cascade into quick $15–$20 losses. In thin markets, even a modest news headline can generate outsized volatility, so any trade must be wrapped in a tight risk leash.
Trading Strategy for Asian Session
Patience matters more than precision this morning. I’m watching a long entry zone between $4,553 and $4,555, using the 1‑hour downside target as my trigger. A buy limit within that band with a stop loss placed at $4,540 — just below the MA20 and the psychological round number — keeps risk to roughly 1.5x the ATR. The initial take‑profit target is $4,570, matching the 4‑hour upside arrow. If momentum accelerates through $4,570, a scaled‑out second target at $4,580 becomes viable.
Conservative traders can wait for a confirmed hourly close above $4,556 to enter, sacrificing a few dollars of upside for confirmation. Under no circumstance should anyone chase a breakout above $4,560 without a solid pullback — thin market breakouts have a habit of reversing within minutes. For those who prefer automated precision, professional gold trading signals can help filter noise during sleepy sessions like this.
A bearish alternative only activates on a decisive break below $4,550. In that case, a short toward $4,542 with a stop above $4,565 becomes the session’s counter‑trend play. Either way, the gold price today demands a scalper’s mindset — clip the profit and walk away, because the bigger trends are still sleeping.
Key Takeaways
- Gold price holds $4,555.56, anchored above the MA20 ($4,540.37) and MA50 ($4,554.16) but still below the MA200 ($4,664.84).
- Asian liquidity remains thin after the US Memorial Day holiday — no major economic events until Friday’s Durable Goods Orders.
- RSI at 52.5 leaves room to rally toward $4,570 without hitting overbought conditions; a drop below 50.0 would shift momentum.
- Key session resistance stands at $4,570 (4‑hour target) and $4,580 (1‑hour target); support lies at $4,553 and $4,542.
- A breakdown below $4,553 invalidates the bullish bias and opens a path to $4,542 and eventually daily supports near $4,667.
- Traders should use tight stops near $4,540 and avoid chasing breakouts during low‑volume conditions.
Conclusion
The gold price is coiling in a narrow band between $4,542 and $4,570, awaiting a catalyst that may not arrive for several days. The short‑term setup leans bullish, with price holding above key dynamic moving averages and the RSI in neutral‑constructive territory. But the distance to the MA200 at $4,664.84 reminds every buyer that the larger trend is still bearish, and rallies must be taken on a speculative basis rather than as trend‑following entries. For those who prefer physical ownership away from leverage, purchase physical gold remains a timeless hedge, but the intraday chart calls for surgical precision. Steady hands, realistic targets, and the humility to sit out when the price action doesn’t align — those are the qualities that separate profitable gold traders in a session like this.
Frequently Asked Questions
- What is the gold price right now?
- The gold price is trading at $4,555.56 as of the Asian session on May 26, 2026. It is oscillating in a tight range ahead of European open.
- What are the key support and resistance levels for XAUUSD today?
- Immediate resistance sits at $4,570 and $4,580. Immediate supports rest at $4,553 and $4,542. A break of $4,540 would shift the bias bearish.
- Is the gold price trend bullish or bearish?
- Short‑term is tentatively bullish while above $4,540.37 (MA20), but the medium‑term picture is still bearish with price below the MA200 at $4,664.84 and the MA20 still below the MA50.
- Why is gold moving so little today?
- Monday’s US Memorial Day holiday drained liquidity, and the economic calendar is bare until Friday’s Durable Goods Orders. The market is in wait‑and‑see mode, creating a narrow, range‑bound Asian session.
- What is a realistic profit target for Asian session gold trades?
- A move from the $4,555 entry zone to $4,570 would yield approximately $15 per ounce, which aligns with the ATR‑based expected range for a slow session. Aggressive traders can stretch to $4,580 if momentum confirms.
Trading Gold (XAU/USD) carries significant risk of loss and is not suitable for all investors. This content is for informational purposes only and does not constitute financial advice. Always conduct your own research and trade responsibly.