
The gold price is trading at $4,587.70 this Tuesday morning, up from the Asian session open of $4,562.66. Last session's geopolitical tensions weighed on the Euro, with EUR/USD dipping to 1.1615, indirectly supporting gold as a safe haven. The market is calm but prepared — liquidity remains thin, and traders are watching for a decisive break above the $4,598.76 short-term moving average.
Gold Market Overview
Macro Context
The US Dollar Index holds steady near 104.50, while Treasury yields edge lower, providing a tailwind for the gold price. The Federal Reserve's next meeting is on the horizon, but no hawkish surprises are priced in yet. The prolonged US-Iran conflict continues to simmer, keeping risk appetite subdued.
Session Outlook
During the Asian session, expect the gold price to oscillate between $4,532 and $4,598.76. With the ATR at $15.48, a 30‑point range is typical. Patience is key — do not chase moves in low liquidity. The bias is cautiously bullish as long as $4,532 holds.
Technical Analysis
Moving Average Structure
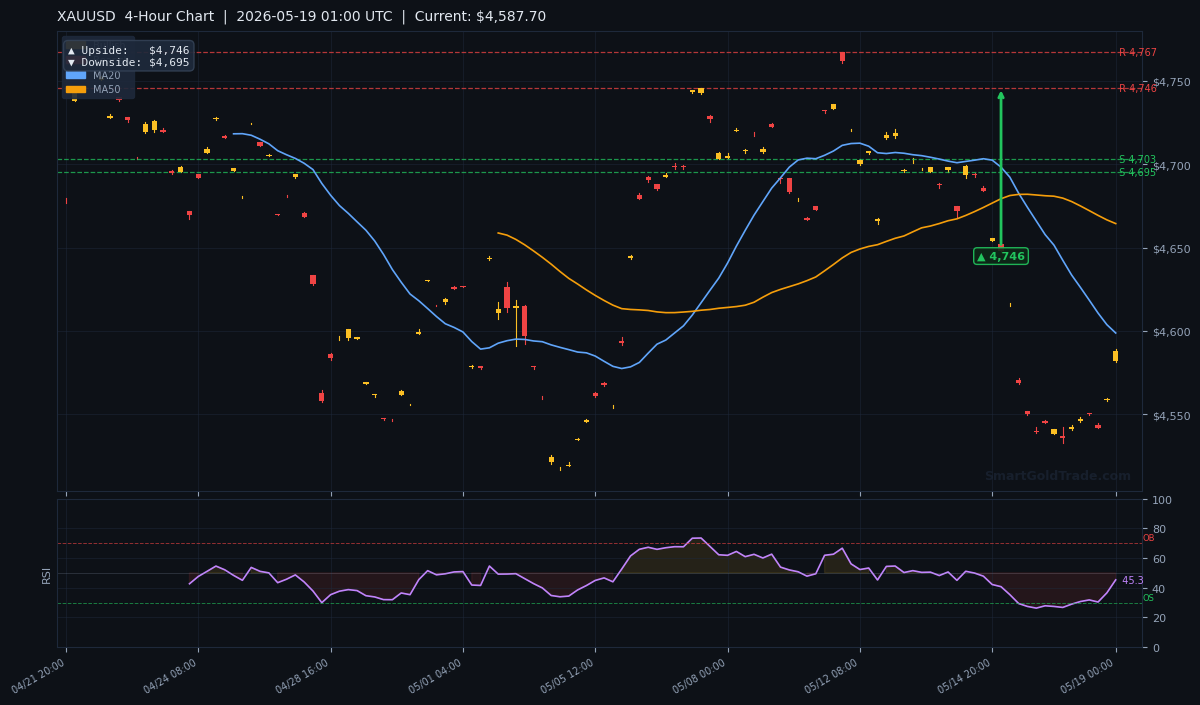
The MA20 sits at $4,598.76, the MA50 at $4,664.38, and the MA200 at $4,691.67. The gold price is below all three moving averages, confirming a bear‑territory structure. However, the gap between price and MA20 has narrowed, hinting at a potential bullish crossover if momentum continues.
RSI and Momentum
The RSI(14) reads 45.3 — neutral, not oversold. This means there is room for both upward and downward moves without extreme readings. Momentum is building, but the lack of oversold conditions suggests the rally may be early.
Key Price Levels
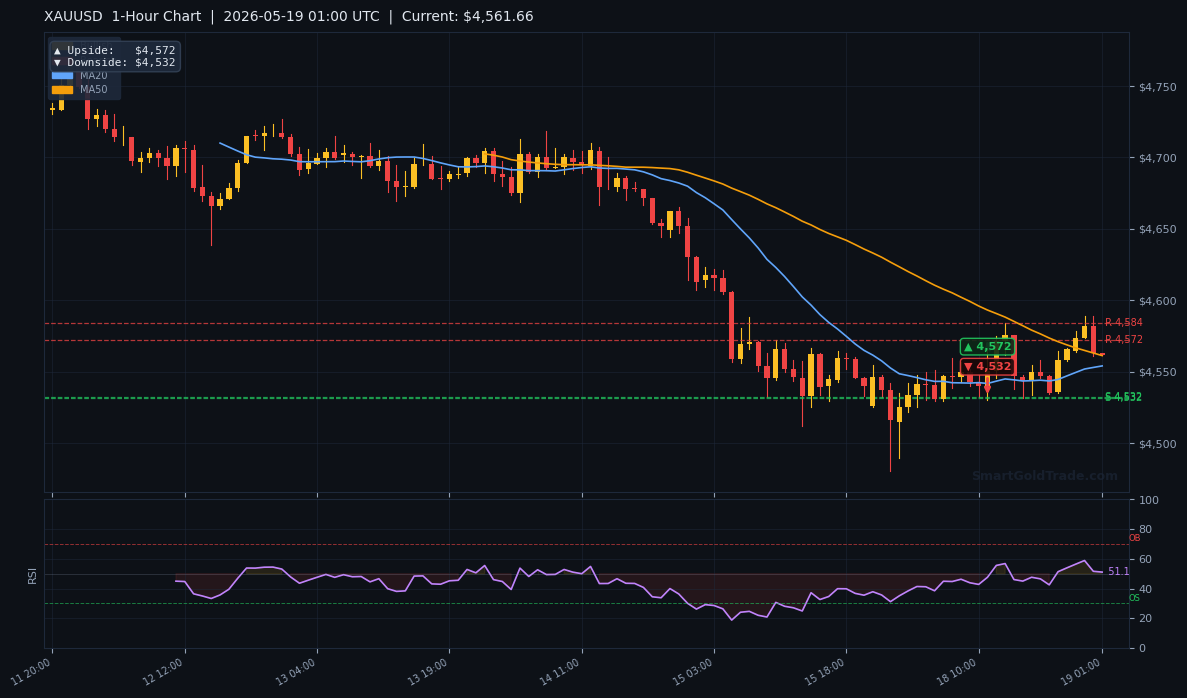
Support: S1 at $4,702.94, S2 at $4,695.39. Resistance: R1 at $4,767.25, R2 at $4,745.97. The chart targets from pivot arrows point to a 4‑hour upside of $4,746 and a 1‑hour upside of $4,572. The daily downside target is $4,667. Based on the ATR, expect a range of roughly $4,570 to $4,602 today. Below is the 4‑hour chart and the 1‑hour chart for closer detail.
| Timeframe | Upside Target | Downside Target |
|---|---|---|
| Daily | $4,838 | $4,667 |
| 4‑Hour | $4,746 | $4,695 |
| 1‑Hour | $4,572 | $4,532 |
Fundamental Drivers
Yesterday's Euro weakness from US‑Iran tensions continues to support safe‑haven demand for the gold price. The EUR/USD drop to 1.1615 signals broader risk aversion. This week, traders will watch the FOMC minutes due Wednesday — any hawkish tone could cap gold's upside.
Key Event to Watch
The Federal Reserve's meeting minutes are the most important event this week. If they hint at rate hikes, the gold price may fall back to $4,667. If dovish, a push to $4,838 is possible. For now, geopolitical tailwinds are the dominant driver.
Devil's Advocate
What could invalidate the bullish bias? A break below $4,532 on the 1‑hour chart would flip the structure bearish. That level is the 1‑hour downside target and a critical support. If the gold price closes below it, expect a retest of $4,467. The RSI at 45.3 is neutral, so a bearish move would not face oversold resistance.
Trading Strategy for Asian Session
Entry zone: Look for a pullback to $4,562–$4,570 (near the 1‑hour upside target area) with confirmation such as a bullish candlestick pattern. Stop loss: Place at $4,532 (1‑hour downside target) — that's roughly 30 points below entry, slightly larger than the ATR. Take profit targets: First target $4,598.76 (MA20), second target $4,746 (4‑hour resistance). Risk‑reward ratio is 1:3 from entry to first target. Use limit orders to avoid slippage in thin liquidity. For those seeking a passive approach, consider copy trading to mirror strategies of experienced gold traders. Additionally, traders looking for real‑time entry signals can subscribe to professional gold trading signals for expert‑analyzed points.
Key Takeaways
- The gold price is trading at $4,587.70, above the Asian session open of $4,562.66.
- Short‑term moving averages (MA20 at $4,598.76) remain above price, but the gap is narrowing.
- RSI at 45.3 is neutral, allowing for further upside without being overbought.
- 4‑hour upside target is $4,746; daily upside target is $4,838.
- Key support at $4,532; a break below could send gold to $4,467.
- ATR of $15.48 suggests a typical daily range of 30 points during this session.
Conclusion
The gold price shows renewed momentum this Asian session, breaking above the $4,587 level and eyeing the 4‑hour resistance at $4,746. The overall trend remains bearish below the 200‑day moving average, but a short‑term bullish swing is developing. Patience is essential — wait for a pullback to $4,562–$4,570 before entering. The FOMC minutes later this week will determine whether this bounce becomes a sustained rally or a dead cat bounce.
Frequently Asked Questions
- What is the current gold price today?
- The gold price is $4,587.70 as of the Asian session on May 19, 2026. It opened at $4,562.66.
- Is gold bullish or bearish in the short term?
- Short‑term bias is cautiously bullish as price moves above the 1‑hour resistance of $4,572. However, the longer‑term structure below MA50 and MA200 remains bearish.
- What is the key resistance level for gold right now?
- The immediate resistance is $4,598.76 (MA20), followed by $4,746 (4‑hour pivot) and $4,838 (daily pivot).
- What support level should I watch for a breakdown?
- Watch $4,532 (1‑hour downside target). If broken, the next support is $4,467 (daily bear target).
Trading Gold (XAU/USD) carries significant risk of loss and is not suitable for all investors. This content is for informational purposes only and does not constitute financial advice. Always conduct your own research and trade responsibly.