
As the gold market evolves, the live gold price now stands at $4,301.37 per troy ounce as of June 15, 2026. This article revisits a real‑time technical breakdown published on May 12, when the gold price was testing a pivotal level near $4,667. The analysis below remains a valuable case study in how geopolitical headlines and technical structures collide, offering timeless lessons for both short‑term traders and long‑term Shariah‑compliant investors.
The gold price is testing critical support at $4,667 this American session, pinned by stalled Iran‑US negotiations and a neutral technical landscape. Monday’s 0.30% advance quickly faded after President Trump dismissed Tehran’s proposal as ‘totally unacceptable,’ leaving traders to weigh diplomatic breakdown against a fragile bullish structure. With price hugging the S2 pivot and the 4‑hour chart flashing a mixed bias, every tick in the next few hours could decide whether gold extends toward $4,746 resistance or breaks below $4,667 for a deeper drawdown.
Why the Gold Price Matters for Shariah‑Compliant Investors
For Muslim traders and investors, tracking the gold price goes beyond profit potential — it’s about aligning with Islamic financial principles. Conventional forex often involves riba and leverage, which are haram, but halal gold trading allows you to benefit from gold price movements with full spot ownership and no interest. This keeps your capital pure while benefiting from gold’s timeless role as a store of value.
Moreover, many Shariah‑conscious savers watch the gold price to time their purchases of physical bullion. Whether you’re buying 22K coins for weddings or 24K bars as a long‑term hedge, the gold price directly affects your real‑world wealth. Platforms that offer Shariah‑audited investment pools, like SmartGoldTrade’s musharakah products, allow you to participate in gold market gains without directly trading contracts.
Gold Market Overview
Macro Context
The DXY index is hovering near 103.80, offering little directional help to gold. U.S. Treasury yields remain anchored after last week’s benign auction cycle, while the Fed’s latest rhetoric keeps rate‑cut expectations balanced between a September and December start. The geopolitical stalemate in the Middle East – the key fundamental upside driver – lost its spark after the diplomatic setback, causing gold to pare gains in early European trade.
Session Outlook
American session liquidity often amplifies technical moves. With no major U.S. data due today, price action will be driven by continued reaction to the Iran‑US headlines and week‑end positioning. The expected range, based on the ATR(14) of $21.52, sits between $4,645 and $4,689 – meaning any break beyond $4,667 support would accelerate volatility. Keep an eye on NY opening flows for a potential fakeout before the real move. As of June 15, the gold price has shifted considerably, but the same principles apply.
Technical Analysis
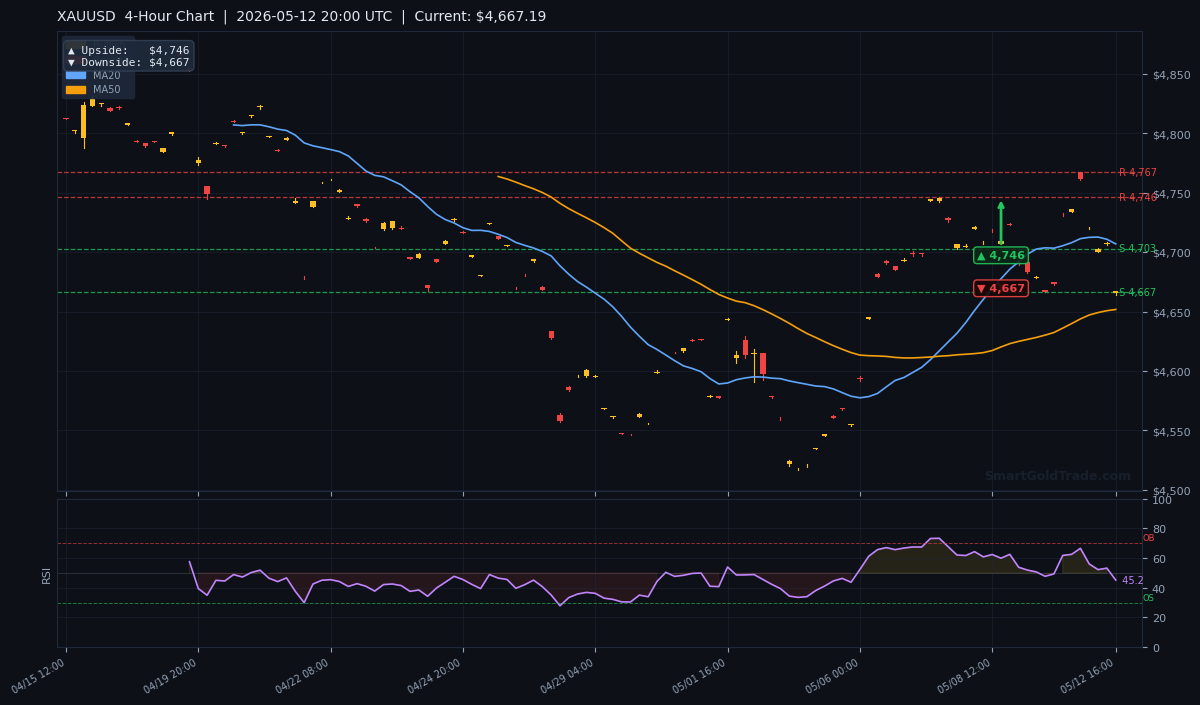
All values below are taken from the live H4 chart at 20:00 UTC, May 12, 2026.
Moving Average Structure
The MA20 at $4,706.86 is below the MA50 at $4,651.72, confirming short‑term bullish momentum. However, price at $4,667.19 is below the MA20 (bearish short‑term) and also below the MA200 at $4,684.16 (bear territory). This creates a tug‑of‑war: the daily structure leans bullish, but the intraday trend is fighting overhead resistance.
RSI and Momentum
The 14‑period RSI reads 45.2 – squarely in neutral territory, with no extreme overbought or oversold signal. This gives neither bulls nor bears a clear momentum edge. Combined with the ATR(14) of $21.52, we can expect a choppy session with a possible 20‑point swing either side.
Key Price Levels
Support levels stand at S1: $4,702.94 (unused now because price is below it) and the critical S2: $4,666.72. The current price of $4,667.19 is nearly touching S2, making it the line in the sand. Resistance holds at R1: $4,767.25 and R2: $4,745.97. A break above the MA200 ($4,684.16) is the first necessary step for bulls to reclaim momentum.
| Timeframe | Upside Target | Downside Target |
|---|---|---|
| Daily | $4,857 | $4,667 |
| 4‑Hour | $4,746 | $4,667 |
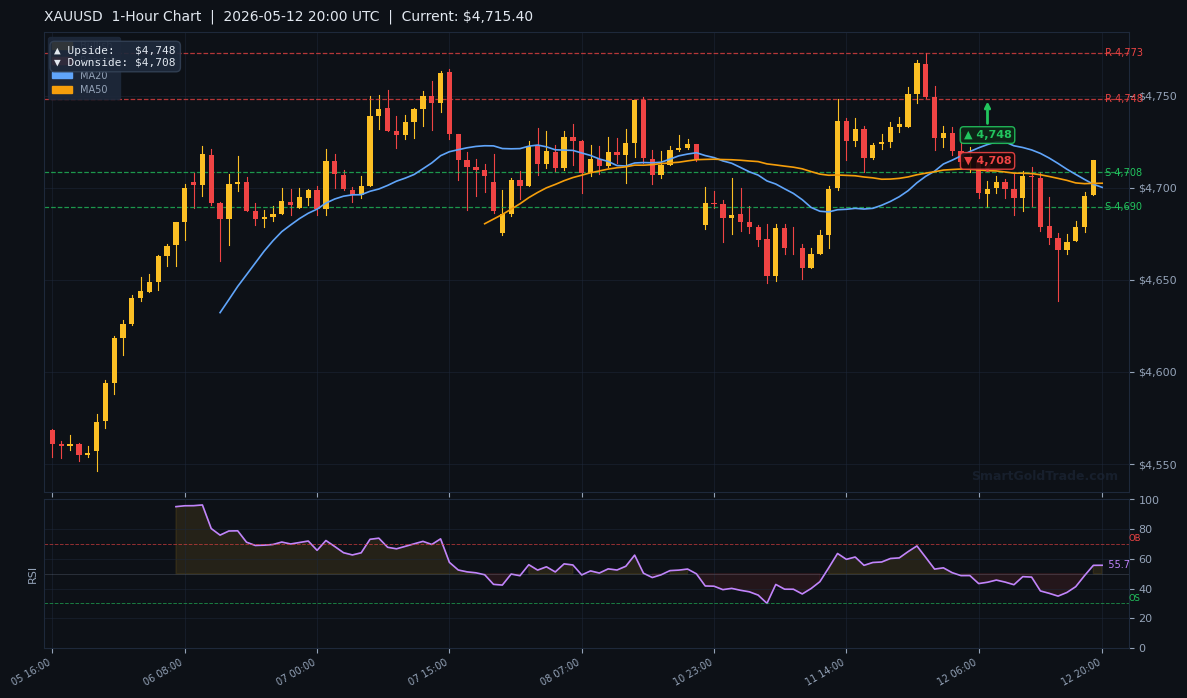
| 1‑Hour | $4,748 | $4,708 |
Fundamental Drivers
The stalled Iran‑US talks are the primary driver today. President Trump’s outright rejection of Tehran’s proposal removes any near‑term hope for détente, but it also fails to provide a fresh catalyst for safe‑haven buying – markets had already priced in tension. Gold’s reaction suggests traders are waiting for a new headline (either a military escalation or a surprise diplomatic breakthrough) to break the stalemate.
Key Event to Watch
This week, traders will monitor Wednesday’s U.S. consumer inflation (CPI) report for May. If core CPI prints above 3.2%, the dollar could strengthen and push gold below $4,667. Conversely, a softer number would revive the dovish Fed narrative and support a bounce toward $4,746.
Devil's Advocate
The bullish thesis for the gold price – a bounce from $4,667 to $4,746 – depends on support holding. A daily close below $4,667 would break the H4 uptrend and open the door to the next demand zone near $4,630. Additionally, if the U.S. dollar strengthens further due to risk‑off flows from geopolitical fears (instead of safe‑haven gold buying), gold could see simultaneous dollar‑driven headwinds. The moment the gold price loses $4,667, the bias flips decisively bearish.
Trading Strategy for American Session
Entry Zone: Buy near $4,667 – the S2 support level – with confirmation from a bullish engulfing candle on the 1‑hour chart. Alternatively, a short entry activates only below $4,663 with a retest of the breakdown.
Stop Loss: For long trades, place the stop at $4,645 (approximately 1 ATR below entry). For short trades, stop above $4,685 (rejection at MA200).
Take Profit Targets: First target at $4,708 (H1 resistance). Second target at $4,746 (H4 resistance). Risk‑reward on this gold price long setup is about 1:2. For professional traders looking to fine‑tune entries, consider using real-time trading alerts from InvestorTipster to catch the exact breakout moment.
Key Takeaways
- Gold price is trading at $4,667.19, just above the critical S2 support.
- MA20/50 structure remains short‑term bullish, but price is below both MA20 and MA200.
- RSI at 45.2 signals neutral momentum – no overbought or oversold conditions.
- ATR of $21.52 points to a session range of roughly $4,645–$4,689.
- Iran‑US stalemate and Wednesday’s CPI are the key catalysts to watch.
- A break below $4,667 invalidates the bullish bias; a move above $4,684 (MA200) reignites upside momentum.
Conclusion
Gold price sits at a pivotal junction. The technical picture is mixed – neutral RSI, a bearish position below the MA200, but a bullish MA20/50 cross. The fundamental driver (geopolitics) is in limbo. For today’s American session, the $4,667 level is the battleground. Bulls need to defend it; a clean break below invites shorts toward $4,630. On the upside, reclaiming $4,684 opens a path to $4,746. Trade with tight stops and watch for the CPI release. For long‑term investors looking to add physical exposure, purchase physical gold from SmartGoldTrade’s certified collection to hedge against the current uncertainty.
FAQ
- Why is $4,667 so important for the gold price today?
- $4,667 is the S2 support on the 4‑hour chart and also the daily downside target from the pivot arrows. It acts as the last line before a potential drop to $4,630. A close below this level would signal a trend reversal.
- Can the gold price rally to $4,746 this week?
- Yes, if support at $4,667 holds and Wednesday’s CPI comes in soft, gold could stage a recovery toward the 4‑hour resistance at $4,746. However, the geopolitical stalemate must also remain unresolved to keep safe‑haven demand alive.
- What is the best stop‑loss for a gold price trade today?
- For a long trade near $4,667, a stop‑loss at $4,645 (1 ATR) is reasonable. For short trades below $4,663, stop above $4,685 to avoid being caught in a fakeout above the MA200.
Risk Disclaimer: Trading Gold (XAU/USD) carries significant risk of loss and is not suitable for all investors. This content is for informational purposes only and does not constitute financial advice. Always conduct your own research and trade responsibly.