
The gold price is trading at $4,808.78, caught in a decisive technical squeeze during the early American session. The market continues to digest last week's inflation data, which confirmed persistent price pressures that have kept the Federal Reserve in a hawkish stance. Today's session will determine if bulls can muster enough strength to challenge the critical $4,846 resistance or if bears will force a retreat towards the $4,788 support zone.
The April 16 trading day presents a classic technical battleground. The price is positioned between key moving averages, reflecting the market's indecision following a period of consolidation. With the dollar index (DXY) hovering near recent highs and Treasury yields offering a firm floor, gold requires a fresh catalyst to break its current range. We expect the New York session's liquidity to provide that directional cue.
Gold Market Overview
Macro Context
The broader macro backdrop remains a headwind for significant gold appreciation. The US Dollar Index maintains its strength, buoyed by relative economic outperformance and a Federal Reserve that has signaled a delayed pivot to rate cuts. Ten-year Treasury yields are holding above 4.5%, preserving the opportunity cost of holding non-yielding bullion. While geopolitical risks in the Middle East provide a lingering bid, the primary driver remains the interest rate narrative and real yield trajectory. Until that dynamic shifts, gold's upside may be capped.
Positioning data shows speculative long positions in gold futures have been trimmed slightly, suggesting some profit-taking ahead of key resistance levels. This creates a potential for a short squeeze if prices break higher, but also indicates a lack of aggressive new bullish conviction at current levels. The market is in a wait-and-see mode, with major allocations waiting for a clearer signal from upcoming economic data.
Session Outlook
The American session typically brings heightened volatility and decisive price action. Today, with no tier-1 US data scheduled, the market will be driven by technical flows and any unscheduled geopolitical or central bank headlines. The expected daily range, based on the ATR of $14.49, suggests a potential high-low swing of roughly $29. The immediate battle will be between the intraday bulls aiming for $4,846 and bears defending the $4,819 level represented by the MA200. Expect liquidity to improve after the London fix, with the most decisive moves often occurring between 10:00 and 14:00 EST.
Technical Analysis
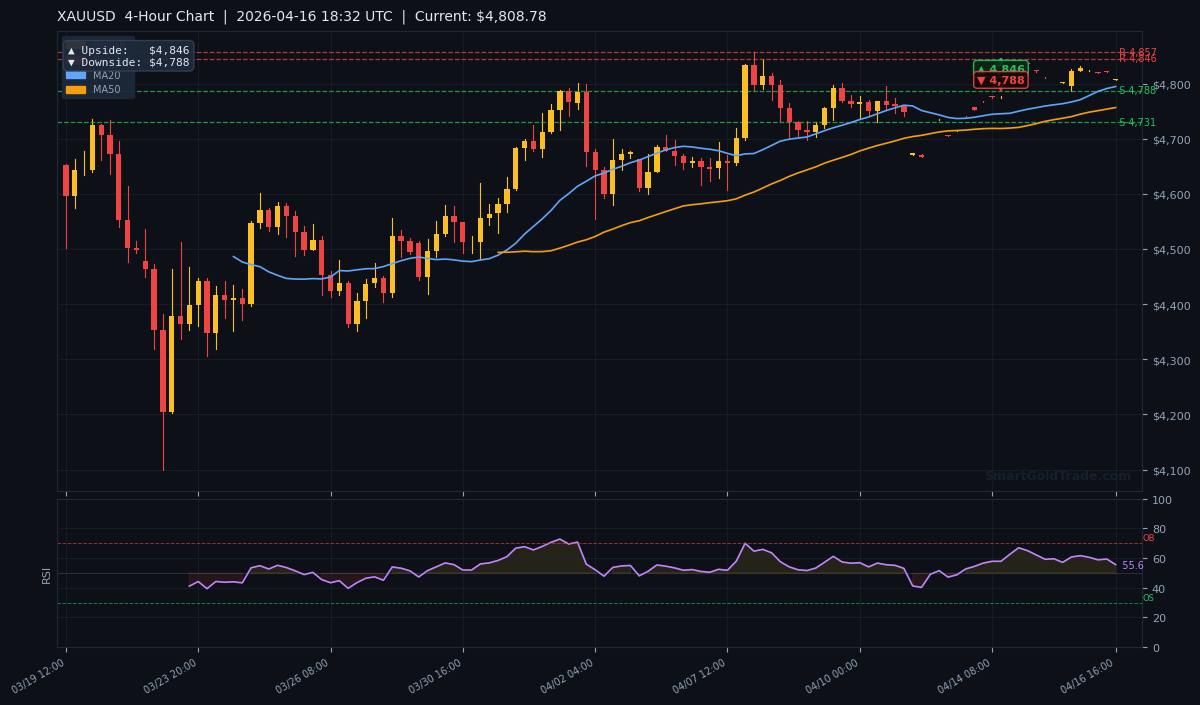
The technical picture presents a mixed but finely balanced outlook on the 4-hour chart. The current price of $4,808.78 is trading above the short-term MA20 at $4,794.86 and the medium-term MA50 at $4,756.71. This EMA structure, where the MA20 > MA50, confirms a short-term bullish momentum bias. However, the price remains below the long-term MA200 at $4,819.20, which keeps the asset in a broader bearish territory on the higher timeframes.
Moving Average Structure
The alignment of the MA20 above the MA50 is constructive for near-term bulls. It indicates that the average buying price over the last 20 periods is higher than over the last 50, a sign of recent accumulation. The critical hurdle is the MA200 at $4,819.20. A sustained break and close above this level would signal a potential trend reversal on the daily chart and could trigger algorithmic buying. Until then, this moving average will act as formidable resistance.
RSI and Momentum
The RSI(14) reads 55.6, squarely in neutral territory. This indicator shows neither overbought nor oversold conditions, providing no clear divergence signal. It suggests there is room for the price to move in either direction before reaching extreme levels. Momentum is essentially balanced, meaning the next major economic data point or significant order flow will likely dictate the short-term path.
Key Price Levels
Based on the computed indicators, the immediate battlefield is clear. The first line of support is at $4,787.61 (S1), with a stronger floor at $4,730.58 (S2). On the upside, initial resistance sits at $4,845.67 (R2), with the primary target for bulls at $4,857.30 (R1). The ATR of $14.49 implies a likely trading range for the session between approximately $4,794 and $4,823, assuming average volatility.
| Timeframe | Upside Target | Downside Target |
|---|---|---|
| Daily | $5,250 | $5,014 |
| 4-Hour | $4,846 | $4,788 |
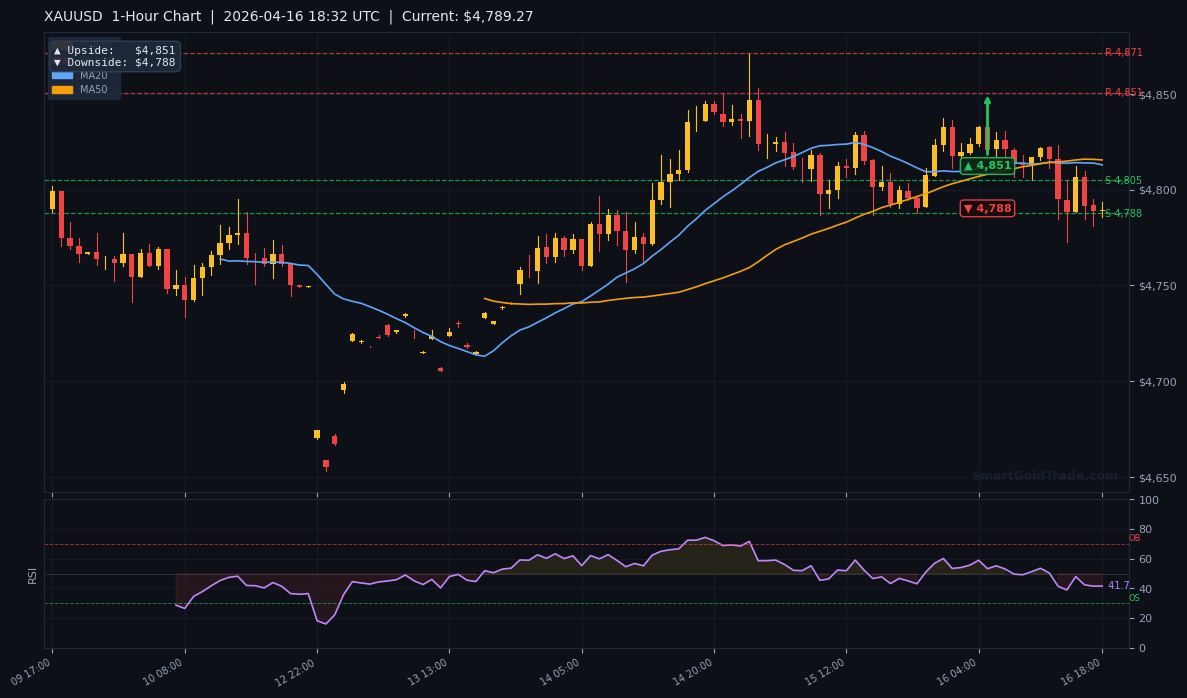
| 1-Hour | $4,851 | $4,788 |
Fundamental Drivers
Beyond immediate interest rate expectations, a structural shift in global trade is providing a long-term undercurrent for gold. As highlighted by Standard Chartered economists, China has solidified its position as the world's largest exporter of AI-related goods. This encompasses everything from raw materials to hardware and applications. This economic strength bolsters demand for commodities and hard assets within China's financial system, indirectly supporting gold as a reserve asset and a hedge against currency volatility in emerging markets.
The direct correlation with the US dollar remains the dominant short-term driver. Any unexpected weakness in the DXY, perhaps from softer housing data or dovish FOMC minutes later this week, would provide immediate fuel for a gold rally. Conversely, stronger-than-expected retail sales or manufacturing data would reinforce the high-for-longer rate narrative, strengthening the dollar and pressuring gold.
Key Event to Watch
This week, traders will watch for the release of the Federal Reserve's Beige Book on Wednesday. While not a market-mover like CPI, it provides nuanced, anecdotal evidence of economic conditions across all districts. Any consistent reports of slowing inflation or cooling employment demand could be interpreted as dovish, potentially weakening the dollar and giving gold a lift towards $4,846. The market is hyper-sensitive to any clues about the timing of the first rate cut.
Devil's Advocate
The primary bullish bias—targeting a break above $4,846—relies on the market finding a dovish catalyst. What if that catalyst never arrives? The most straightforward invalidation level is a breakdown below the $4,787.61 (S1) support. Such a move would break the short-term bullish structure indicated by the MA20 > MA50 alignment and likely trigger a swift test of $4,730.58 (S2).
A scenario that flips the trade bearish would involve a strong US data print combined with hawkish Fed speaker commentary. This would reinforce the 'higher for longer' narrative, boost the dollar and yields simultaneously, and likely force a liquidation of speculative long positions in gold. In this environment, the path of least resistance becomes down, targeting the $4,730 area.
Trading Strategy for American Session
Given the neutral RSI and price compression between key moving averages, a breakout strategy is preferred over a range trade. The optimal approach is to wait for a confirmed move above $4,819.20 (the MA200) or below $4,787.61 (S1) before committing capital.
Bullish Breakout Setup: A sustained 4-hour close above $4,820 could be used as a trigger for a long entry. An initial stop loss can be placed at $4,800, just below the breakout level, representing a ~$20 risk. The first take-profit target would be $4,845.67 (R2), with a secondary runner target at $4,857.30 (R1). This offers a potential risk-reward ratio above 1:1.
Bearish Breakdown Setup: A break and hold below $4,787.61 could signal a short opportunity. An entry near $4,785 with a stop at $4,805 (above the MA20) risks approximately $20. The initial target would be the stronger $4,730.58 (S2) support. The wide stop is necessary to account for the ATR and avoid being stopped out by normal volatility.
Key Takeaways
- The gold price at $4,808.78 is in a technical standoff, trading above the MA50 but below the critical MA200 at $4,819.20.
- Immediate resistance is clustered between $4,845.67 and $4,857.30, while support rests at $4,787.61 and $4,730.58.
- The neutral RSI of 55.6 indicates balanced momentum, meaning the next directional move will likely require a fundamental catalyst.
- The American session's higher liquidity is expected to resolve the current compression, with a breakout above $4,820 or below $4,788 providing the clearest signals.
- Traders awaiting a clearer trend might consider a copy trading approach, mirroring experienced traders' execution during this uncertain phase.
- Risk management is paramount; using the ATR value of $14.49 to guide stop-loss placement helps avoid being whipsawed.
Conclusion
The gold market on April 16 is at an inflection point. The technical configuration suggests a coiled spring, with the potential for a decisive move once the New York session's full force is felt. The bias is cautiously bullish above $4,819.20, targeting a test of $4,846. However, respect for the bearish pressure from a strong dollar and high yields mandates a disciplined, signal-based approach. A failure to reclaim the MA200 will keep the longer-term trend in question and could prompt a deeper retracement. The coming hours will provide much-needed clarity.
Frequently Asked Questions
- What is the most important level for gold price today?
- The long-term moving average at $4,819.20 (MA200) is the key pivot. A sustained break above it shifts the bias bullish, while a rejection from it favors the bears.
- Where should I place a stop loss if I'm buying gold?
- For a long position initiated near current levels, a logical stop loss is below the nearest support at $4,787.61, perhaps at $4,780 to allow for normal volatility.
- What is a realistic target if gold breaks higher?
- The first significant target on a bullish breakout is the 4-hour resistance at $4,846, followed by the daily resistance at $4,857.30.
- How does the high US dollar affect gold?
- A strong US Dollar Index (DXY) makes dollar-denominated gold more expensive for foreign buyers, which typically dampens demand and caps the price, as we see near the $4,819 resistance.
Trading Gold (XAU/USD) carries significant risk of loss and is not suitable for all investors. This content is for informational purposes only and does not constitute financial advice. Always conduct your own research and trade responsibly.