
The gold price opens the American session at $4,363.71, caught in a critical tug-of-war between short-term momentum and a dominant long-term downtrend. Last week's hotter-than-expected inflation data from the US has already been absorbed, setting a hawkish backdrop for Fed expectations. This session's price action will hinge on whether dip-buyers can defend the mid-term support or if bears capitalize on the metal's position below the 200-day moving average.
The gold price has stabilized above the $4,350 handle in early New York trading. However, with the dollar showing resilience and Treasury yields elevated, the path of least resistance remains uncertain. Traders must watch for a decisive break from this consolidation zone, which could set the tone for the rest of the week.
Gold Market Overview
Macro Context
The US Dollar Index (DXY) remains a primary headwind for gold, holding near monthly highs as markets continue to price in a patient Federal Reserve. Last week's PPI and CPI prints reinforced the narrative that disinflation has stalled, pushing the timeline for potential rate cuts further into the future. This keeps real yields elevated, eroding the non-yielding appeal of bullion.
Geopolitical tensions, while present, are currently taking a backseat to monetary policy dynamics. The absence of fresh, market-moving escalations has removed a key pillar of support that previously fueled safe-haven flows into gold. The focus is squarely on economic resilience and the Fed's data-dependent stance.
Session Outlook
The American session brings the peak liquidity of the trading day, often where major trends are confirmed or reversed. Expect volatility to pick up as New York desks fully engage. The immediate trigger will be any deviation from the established $4,340 - $4,400 hourly range. A break below $4,340 could accelerate selling toward the 4-hour downside target of $4,310.
Traders should monitor intraday bond auctions and any unscheduled Fed commentary, which can swiftly alter rate expectations and gold's trajectory. The session's expected range, based on the ATR(14) of $16.63, suggests a potential swing of roughly $33 from the session open.
Gold Price Technical Analysis
Gold's technical structure paints a mixed picture, with conflicting signals across different timeframes. The short-term setup is cautiously bullish, but it operates beneath the shadow of a significant long-term resistance level. This creates a high-risk, high-reward environment where precision in level management is paramount.
Moving Average Structure
The moving averages tell the story of a market in transition. The gold price at $4,363.71 sits above the MA20 at $4,340 and the MA50 at $4,310, confirming short-to-medium term bullish momentum. However, the critical MA200 at $4,450 looms overhead like a ceiling.
This puts gold in bearish territory from a long-term trend perspective. The bullish sequence of MA20 above MA50 is encouraging for dip-buyers, but a sustained move above the 200-day average is needed to signal a true trend reversal. Until then, rallies are suspect.
RSI and Momentum
The RSI(14) reading of 57.1 sits firmly in neutral territory. It is neither overbought nor oversold, providing no clear directional bias from momentum alone. This neutral reading suggests the market has room to move in either direction before becoming exhausted, aligning with the consolidation seen on lower timeframes.
It indicates that the recent pullback from the $4,400 area was a healthy correction, not a momentum collapse. For bullish traders, an RSI dip toward 50 could present a favorable entry, provided key supports hold. For bears, a failure to break above 60 on the next rally attempt would signal weakness.
Key Price Levels
The battle lines for this session are clearly drawn by the indicator-derived support and resistance levels. On the upside, R1 at $4,400 and R2 at $4,420 form a formidable resistance band. A decisive break above this zone would target the daily chart's upside objective of $4,500.
On the downside, the immediate safety net is S1 at $4,310. A breach here would quickly test the more substantial S2 at $4,285. The 4-hour chart's downside target aligns perfectly with S1 at $4,310, marking it as today's line in the sand for the bullish thesis.
| Timeframe | Upside Target | Downside Target |
|---|---|---|
| Daily | $4,500 | $4,200 |
| 4-Hour | $4,415 | $4,310 |
| 1-Hour | $4,400 | $4,340 |
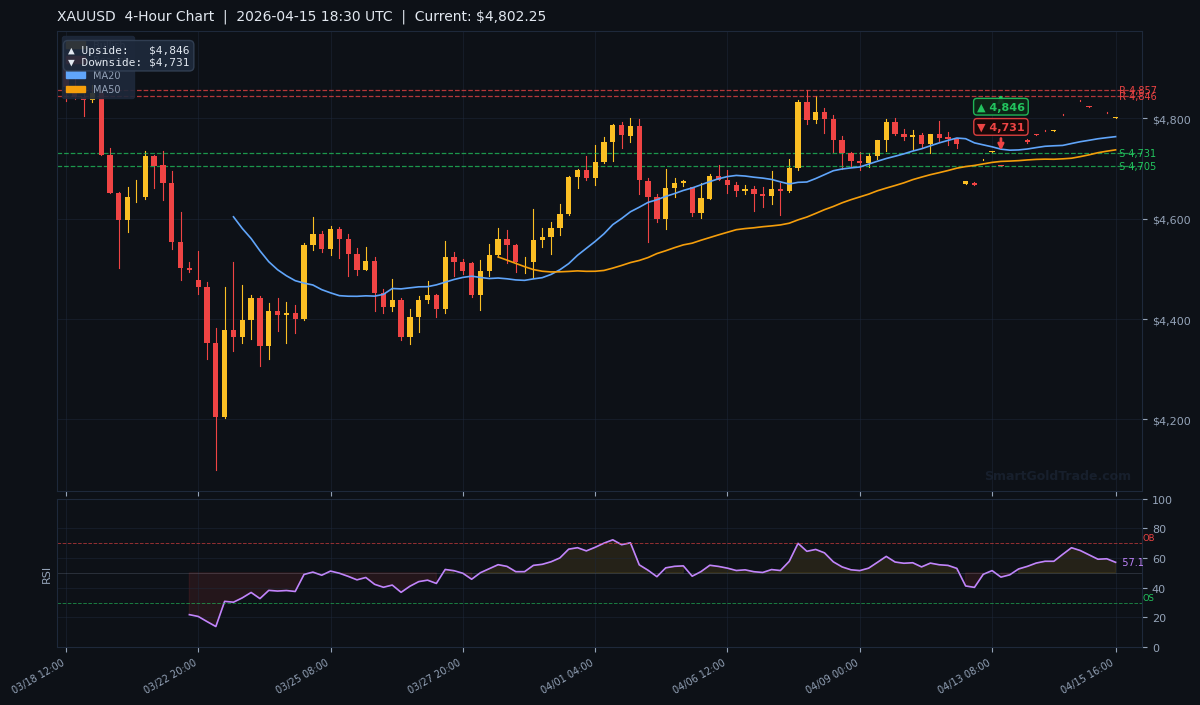
The 4-hour chart shows price compression between the moving averages and the $4,400 resistance. The $4,310 downside target from the pivot arrow is the level to watch for a potential breakdown.
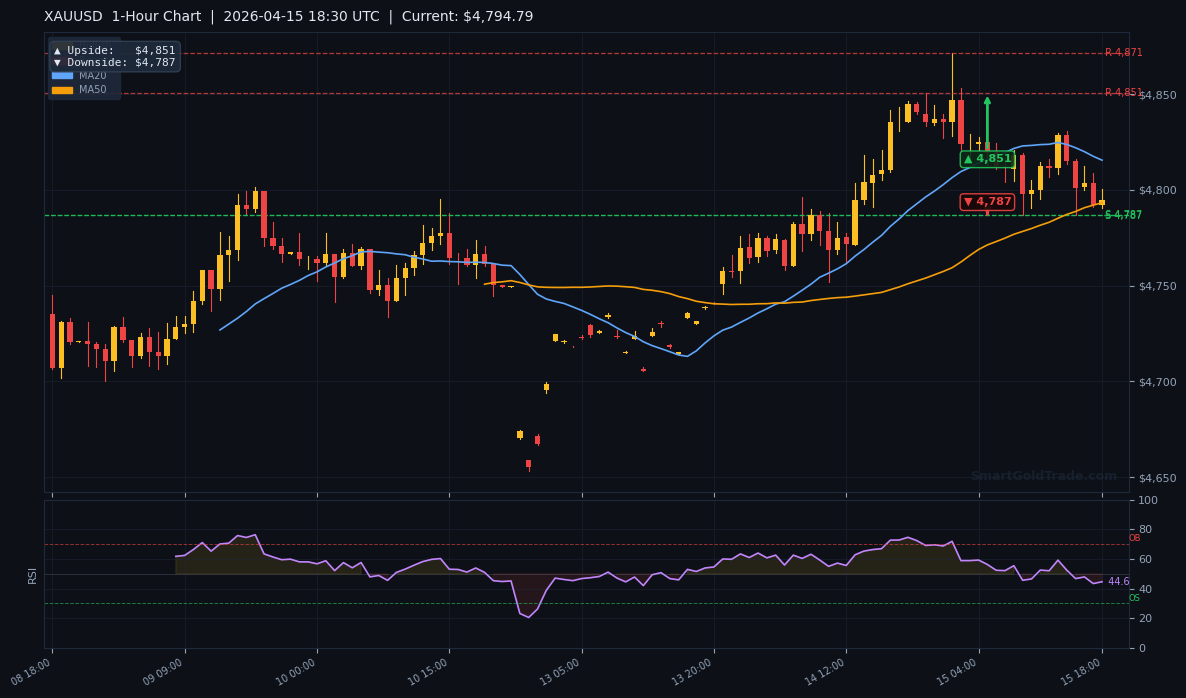
The 1-hour chart reveals the immediate battleground. The gold price is coiling between $4,340 and $4,400, with a breakout from this range likely to dictate the short-term direction for the remainder of the NY session.
Fundamental Drivers
The primary fundamental weight on gold remains the recalibrated outlook for US interest rates. The market narrative has shifted from 'when' the Fed will cut to 'if' they will cut in 2026 at all. This week, the focus turns to retail sales and housing data, which could further cement the view of a resilient US economy.
While last week's inflation scare is in the rearview mirror, its impact persists in the form of repriced Fed expectations. The correlation with the US dollar remains strongly negative. Any unexpected dollar strength during the NY session, perhaps from a flight-to-quality move in other assets, would directly pressure gold lower.
Key Event to Watch
This week, traders will watch Thursday's US Retail Sales data for March. A strong consumer spending print would affirm economic strength and further delay rate cut expectations, applying sustained downward pressure on gold. Conversely, a significant miss could revive hopes for 2026 policy easing, potentially triggering a short-covering rally in gold back toward the $4,400 - $4,420 resistance zone.
Devil's Advocate
The prevailing short-term bullish momentum is fragile. A break below the $4,310 (S1) support level would invalidate the current consolidation-as-bullish-flag pattern. Such a move would signal that the selling pressure from the $4,400 resistance area is more potent than the dip-buying interest.
This scenario would likely trigger a swift move down to test the $4,285 (S2) level. If that fails, the entire short-term bullish structure—with price above the MA20 and MA50—would unravel, opening the path toward the daily downside target of $4,200. A close below the MA50 at $4,310 would be the first technical warning sign.
Trading Strategy for American Session
Given the conflicting signals, a cautious, level-based approach is warranted. The optimal bullish entry zone is on a dip toward the confluence of support between $4,310 - $4,320 (S1/MA50). A stop loss should be placed just below $4,285 (S2), utilizing the ATR value for a risk of approximately $25.
The first take-profit target is the session high near $4,380. The primary target is the 4-hour resistance at $4,415. A break and hold above that opens the path to $4,420 (R2). For bearish traders, a breakdown below $4,340 (1-hour downside target) offers a short entry with a stop above $4,380 and a target at $4,310.
While manual level analysis is effective, some traders add confidence by subscribing to professional gold trading signals that deliver entry and exit levels directly. Risk management remains critical no matter the approach. Position sizes should account for the elevated volatility indicated by the $16.63 ATR. For those who want a managed, Shariah-compliant way to participate, our mudarabah investment plans handle the decisions. If you prefer to trade actively while staying riba-free, explore our halal gold trading platform built on spot ownership.
Key Takeaways
- The gold price at $4,363.71 is in a tense battle between short-term bullish momentum and long-term bearish pressure below the MA200 at $4,450.
- Critical support for the bullish view is at $4,310 (S1). A break below targets $4,285 (S2).
- Immediate resistance is clustered between $4,400 (R1) and $4,420 (R2).
- The neutral RSI at 57.1 suggests the market is not overextended and has room to move in either direction.
- Expected daily volatility, based on the ATR, is approximately $33.
- The 4-hour chart provides the clearest near-term bias, with a pivot arrow pointing to a downside target of $4,310.
Conclusion
The New York session begins with gold perched precariously. The technical setup favors a defensive posture, with the risk skewed toward a test of lower support. While the moving average structure below the price is supportive, the failure to reclaim territory above the 200-day average keeps the broader trend in question. The reaction at $4,310 will be telling.
Traders should prepare for a volatile session defined by the battle between these clearly defined technical levels. The outcome will set the directional bias not just for the day, but potentially for the remainder of the week. A firm break in either direction from the current compression will offer the next high-probability trading opportunity.
FAQ
- What is the most important gold price level to watch today?
- The $4,310 support level is critical. It represents the 4-hour chart's downside target and aligns with the S1 support. A break below this signals a high probability move toward $4,285.
- Is gold in a bull or bear market currently?
- Technically, gold is in a long-term bear market while the gold price remains below the MA200 at $4,450. However, the short-term picture is bullish above the MA20 and MA50, creating a mixed outlook.
- How does Fed policy influence the gold price?
- Higher interest rates and hawkish Fed expectations tend to pressure the gold price by boosting the dollar and real yields. Conversely, dovish signals or rate cuts can spark gold rallies.