Gold price is flashing momentum signals as European markets open on Friday, June 19. After holding above $4,150 during the Asian session, XAUUSD has climbed to $4,176.29 in early European trade, now testing a crucial resistance zone near $4,356 — with the larger $4,365 barrier looming overhead. Yesterday’s UK labor market data fueled a broad risk-on move, lifting GBP and temporarily weakening the dollar, but gold bulls are seizing the early European bid, pushing the gold price higher. The short-term moving averages have issued a bullish crossover while the RSI begins to stir, creating a compelling technical setup. This session could determine whether the bounce has legs or fades at resistance. With US consumer sentiment data due later today, the breakout window is narrow and action is likely. Volatility is set to spike as London desks fully engage, making precise entry points vital.
Gold Price and Market Overview
Macro Context
The US Dollar Index (DXY) is hovering near 104.50 as European traders step in, while the 10-year US Treasury yield remains sticky above 4.40%. The Federal Reserve’s latest dot plot from last week’s meeting signaled one more rate hike this year, keeping the gold price under pressure. Geopolitical tensions, particularly the ongoing US-Iran negotiations, are providing intermittent support, preventing a deeper slide. The lack of a definitive safe-haven bid is keeping the metal within a well-defined technical range.
Session Outlook
The European session typically injects deeper liquidity, and today’s open is already showing a 0.4% intraday gain. With London desks starting their day, the gold price could test $4,365 quickly. Range: $4,315 to $4,365. Key trigger: US Michigan consumer sentiment final due at 14:00 GMT will be the catalyst for the afternoon. A strong reading could cap the rally, while a miss may unleash a breakout.
Technical Analysis
Moving Average Structure
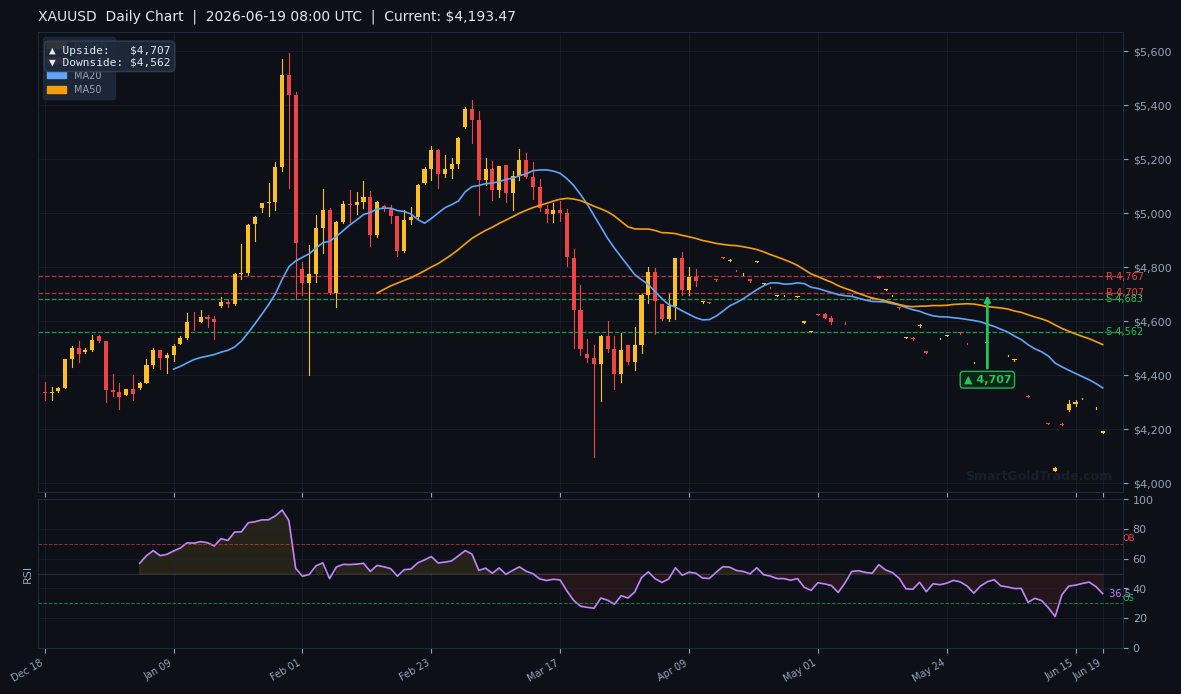
The gold price trades below the MA20 at $4,291.83, the MA50 at $4,248.65, and the MA200 at $4,476.09 — still bearish territory on the daily. Yet a notable detail: the MA20 has crossed above the MA50, forming a short-term bullish EMA structure. This 'golden cross' in shorter moving averages suggests momentum is shifting, even as the trend remains bearish. Bulls need a daily close above $4,365 to confirm a trend change.
RSI and Momentum
The 14-period RSI reads 33.0, just above oversold territory. This neutral-to-weak reading often marks a base for a bounce when the gold price starts pushing higher. A move above 40 would confirm the bullish momentum. Until then, caution is warranted. The ATR of $31.97 implies a daily range near $32, making a break of these levels plausible within today’s session.
Key Price Levels
Immediate support sits at $4,315.62 (S1) and $4,313.77 (S2). Resistance stands at $4,356.90 (R2) and $4,365.61 (R1). The gold price's chart-based floor of $4,153.69 is being overtaken by live bids near $4,176.29 as London opens — a sign that the market wants to test higher. Below is a summary of the pivot targets drawn from the charts.
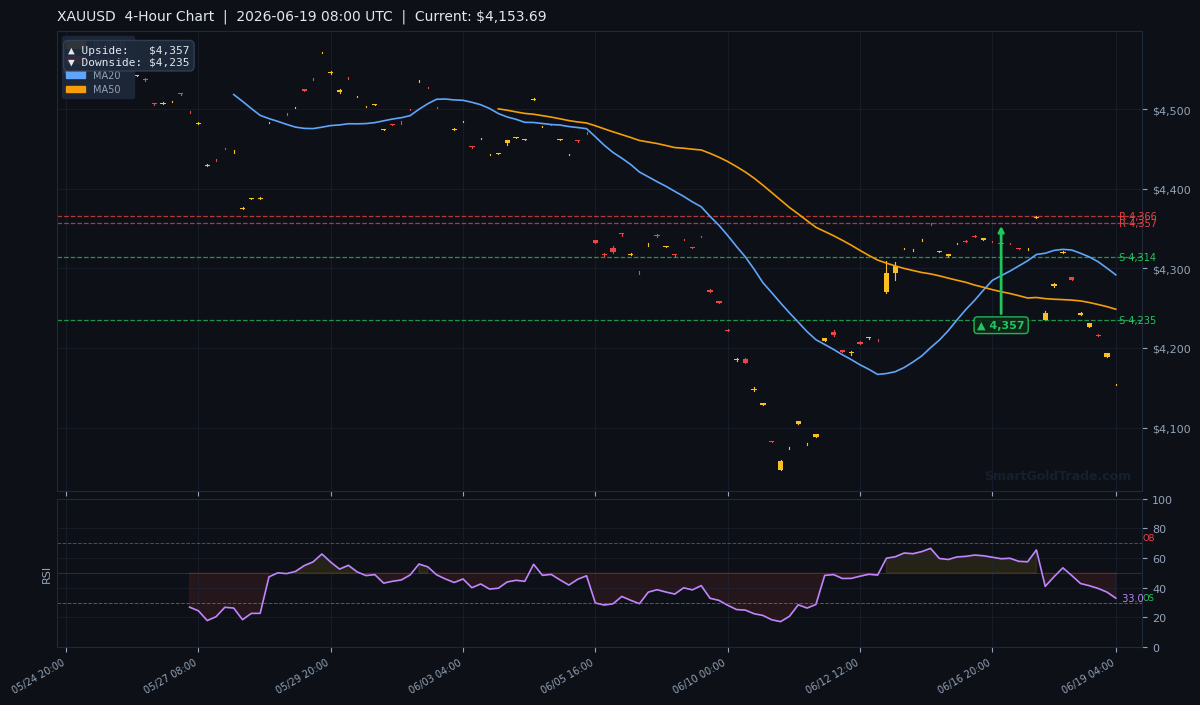
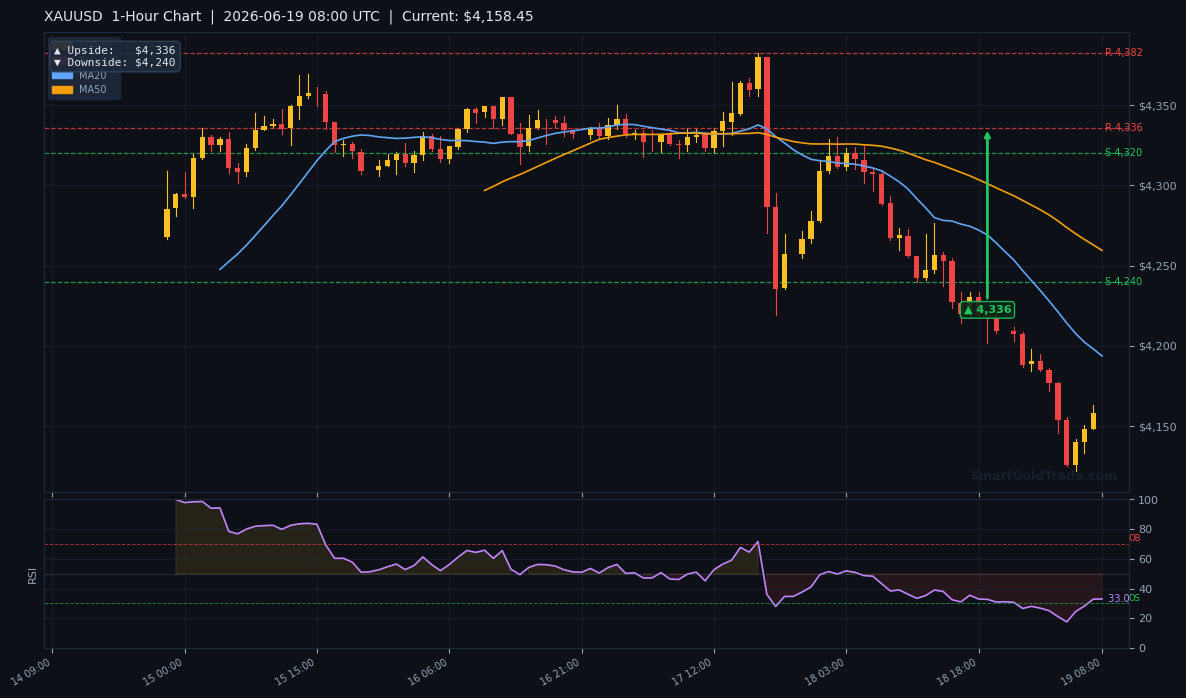
| Timeframe | Upside Target | Downside Target |
|---|---|---|
| Daily | $4,707 | $4,562 |
| 4-Hour | $4,357 | $4,235 |
| 1-Hour | $4,336 | $4,240 |
Fundamental Drivers
Yesterday’s UK jobs report showed a fall in unemployment, lifting GBP and risk appetite, which briefly pressured the dollar. The gold price inched higher on the back of that move. However, hawkish Fed speak from earlier this week — particularly a reminder of Warsh’s first call as Fed chair — keeps the dollar supported. The DXY-gold inverse correlation remains intact; any DXY drop below 104.00 would open the door for gold’s push beyond $4,365.
The US-Iran peace deal talks are in a sensitive phase. Progress could undermine gold’s safe-haven appeal, but no concrete breakthrough means no sell-off yet. The metal is reacting more to rate expectations and yield movements than to geopolitical headlines this week.
Key Event to Watch
The University of Michigan final consumer sentiment for June, due at 14:00 GMT, will be the volatility driver for the US session. A reading above expectations could strengthen the dollar and cap the gold price below $4,365; a miss could ignite a breakout toward the daily upside target of $4,707. Traders should brace for a sharp move within 30 minutes of the release.
Devil's Advocate
A failure to hold above $4,315 would shift the bias bearish, sending the gold price toward the 4-hour downside target at $4,235. If the European session fails to sustain momentum and price slips back under the MA20 ($4,291.83), the short-term bullish EMA cross would be invalidated. Any fresh hawkish headline from the Fed or an unexpectedly strong consumer sentiment print could be the catalyst for such a reversal.
Trading Strategy for European Session
Buy spot gold near the current gold price of $4,176.29, placing a stop loss at $4,305 (below S2 with a cushion). Initial take-profit sits at the 4-hour upside target of $4,357, while a more ambitious target is $4,365 (R1). The $31.97 ATR justifies a wider stop in this volatile session, but risk should remain below 2% of capital. For Shariah-compliant traders, halal gold trading on spot platforms ensures no swap costs while executing this momentum play. If the $4,365 resistance is breached with a 1-hour close above it, the daily target of $4,707 becomes the next objective for the gold price.
For real-time precision, subscribing to professional gold trading signals can alert you to the exact moment the breakout is confirmed. A confirmed break should also see the RSI push above 40, adding confidence to the position. If price rejects $4,356 and slides below the intraday low of $4,150, exit longs and wait for the $4,315 support test.
Key Takeaways
- Gold price tests $4,365 resistance (R1) after a 0.4% intraday bounce — momentum is building.
- Support at $4,315.62 must hold to avoid a slide toward the 4-hour target of $4,235.
- EMA structure shows MA20 above MA50, signaling short-term bullish momentum despite the overall bearish trend.
- RSI at 33.0 suggests a base for a bounce; a move above 40 would confirm strength.
- ATR of $31.97 implies a $32 daily range — keep stops wide enough to absorb noise.
- Upcoming US consumer sentiment data is the single biggest catalyst for the European and US sessions.
Long-Term Gold Price Outlook
While today’s gold price action revolves around technical levels and macroeconomic data, the metal's multi-year uptrend remains a compelling story for long-term investors. Physical gold ownership — buying certified coins and bars — offers a direct hedge against currency devaluation and inflation, without the complications of futures or leveraged trading. At SmartGoldTrade, you can purchase physical gold in the form of Shariah-compliant 22K coins and 24K bars, taking full title to the metal. Holding tangible assets ensures that irrespective of short-term gold price fluctuations, your wealth is anchored in something real. This approach aligns with Islamic finance principles, as there’s no interest, no speculation, and no counterparty risk. Over decades, the gold price has proven its ability to preserve purchasing power, making it a cornerstone of any halal portfolio.
Conclusion
The gold price is squarely focused on $4,365 today. If the bullish EMA cross and oversold RSI ignite follow-through, a breakout could target $4,707 on the daily chart. However, support at $4,315 is non-negotiable for bulls. With a volatile session ahead, traders should watch the US data release and react quickly. The path of least resistance is upward, but the gold price remains in a bearish trend until $4,365 is cleared. Discipline and tight risk management will separate winners from gamblers.
Frequently Asked Questions
- What is the current gold price today?
- As of June 19, 2026 at 08:30 UTC, the gold price is $4,176.29, with intraday momentum building toward $4,365 resistance.
- What are the key support and resistance levels for gold?
- Immediate support stands at $4,315.62 (S1), while critical resistance lies at $4,365.61 (R1). A break above R1 could drive the metal toward the daily target of $4,707.
- Is gold in a bearish or bullish trend?
- Despite the gold price trading below all major moving averages, the short-term EMA structure (MA20 above MA50) signals bullish momentum. A daily close above $4,365 would confirm a trend change and could propel the gold price higher.
Risk Disclaimer: Trading Gold (XAU/USD) carries significant risk of loss and is not suitable for all investors. This content is for informational purposes only and does not constitute financial advice. Always conduct your own research and trade responsibly.