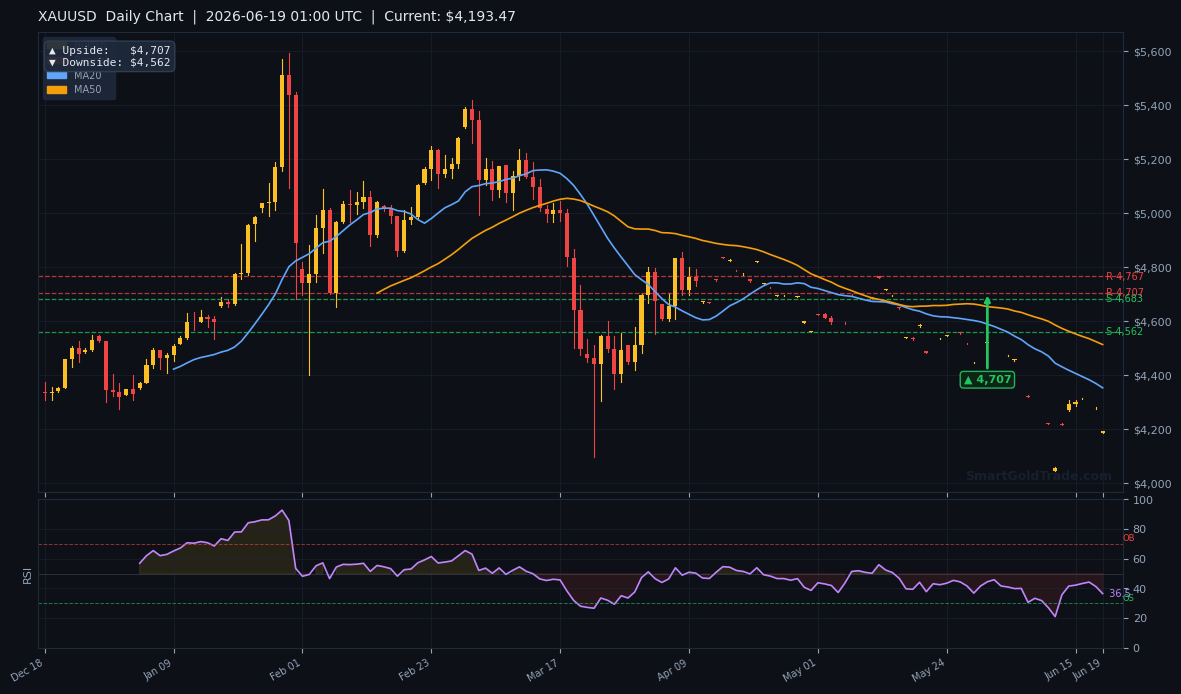
Gold price opens the Asian session at $4,179.50 on Thursday, June 19, extending its decline as thin liquidity exaggerates the early-morning tape. The market is still digesting the historic US-Iran peace deal signed yesterday, which lifted risk assets and briefly pressured the US dollar. Despite the softer greenback — usually a tailwind for precious metals — the gold price stubbornly refuses to catch a bid, trading below every key moving average on the 4-hour chart. Traders should refrain from chasing any pop until volume confirms genuine conviction. This morning's setup leans decisively bearish, with the next leg lower targeting the $4,150 zone, a level clearly emerging on intraday charts.
Gold Price Asian Session Overview
Macro Context
The US Dollar Index (DXY) opens lower, extending yesterday's dip after President Trump inked the US-Iran memorandum of understanding. A softer greenback normally props up the gold price, yet the yellow metal has failed to capitalize — that divergence alone signals a stubborn bearish undertone.
US 10-year Treasury yields hold firm near 4.52%, preventing non-yielding assets from gaining any meaningful traction. The Federal Reserve's hawkish stance from last week's dot plot, which projected higher-for-longer interest rates, continues to weigh on the gold price and the broader precious metals complex. In this macro mix, gold finds scant haven appetite; even the euro's recovery to 1.1515 against the dollar underscores how capital is rotating away from safety plays and into risk assets. With real yields staying elevated and the opportunity cost of holding bullion rising, the gold price lacks a compelling bullish catalyst right now.
Session Outlook
Asian liquidity is notoriously thin, and gold price swings during this window can be exaggerated without genuine institutional flow behind them. The $4,200 psychological round number, which previously acted as support, now serves as a near-term ceiling. A sustained break below $4,175 would open the door to the $4,150 region. Key triggers for this session include an expected Chinese industrial profits print at 02:00 UTC — though unless a major surprise materializes, the gold price will likely oscillate between $4,165 and $4,200. Traders should avoid chasing breakouts in low volume; wait for London's opening to confirm direction before committing capital.
Technical Analysis
Moving Average Structure
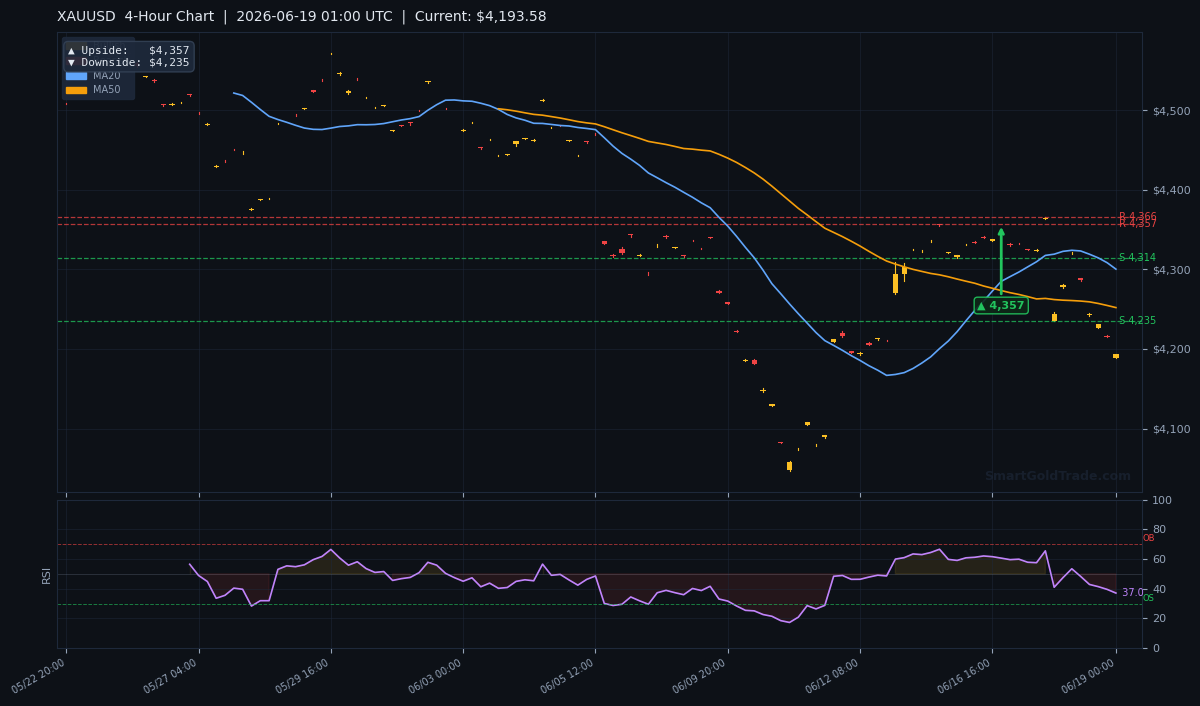
The 20-period simple moving average (MA20) stands at $4,300.22, the 50-period at $4,251.91, and the 200-period at $4,478.10. The gold price trades below all three, confirming a textbook bearish alignment across the short, medium, and long-term trend indicators. The MA20 remains marginally above the MA50, flashing a faint short-term bullish momentum signal, but the gap is shrinking fast. A crossover where the MA20 drops below the MA50 would trigger a death cross, reinforcing the sell bias and likely accelerating the gold price decline. Until bulls reclaim $4,300 with a daily close above it, the intermediate trend belongs squarely to sellers.
RSI and Momentum
The 14-period Relative Strength Index (RSI) on the 4-hour chart reads 37.0, well inside neutral territory but leaning decidedly bearish. It has not yet reached the oversold 30 mark, meaning the gold price still has room to fall before any mean-reversion bounce becomes technically likely. Any intraday pop is expected to meet fresh selling pressure at the moving average cluster, capping recovery attempts.
Key Price Levels
The $4,315 area — previously a critical support zone (S1 at $4,315.86 and S2 at $4,315.62) — has now flipped to formidable resistance after the gold price sliced through it. This level marks the line in the sand for any bullish reversal attempt. On the upside, resistance R1 sits at $4,365.61 and R2 at $4,356.90, creating a reinforced ceiling between $4,356 and $4,366 that will be tough to crack without a fresh macro catalyst.
Below the current gold price, the next meaningful support does not emerge until the $4,150–$4,160 region, with a secondary target at $4,120 if selling momentum accelerates. The Average True Range (ATR) of $29.42 suggests a typical daily range of roughly $59, implying today's gold price could swing anywhere between $4,150 and $4,210 if volatility holds steady.
Fundamental Drivers
The US-Iran memorandum of understanding dominates the news cycle, triggering a risk-on rotation that drains safe-haven flows from the gold price. The euro's pop to 1.1515 against the dollar signals that capital is moving decisively out of defensive positions — and gold's inability to rally despite a softer dollar is the kind of bearish divergence that seasoned traders watch closely. Meanwhile, the Fed's recent minutes underscored caution on rate cuts, with markets now pricing a 62% probability that the first cut arrives only in Q4. The higher opportunity cost of holding a non-yielding asset like bullion remains a persistent headwind for the gold price.
Geopolitically, Iran tensions have subsided for now, removing a major risk premium that had supported the gold price in previous weeks. However, a potential flare-up in Ukraine lingers in the background — an unpredictable variable that could reintroduce haven bids at short notice. For the moment, however, the fundamental picture offers little oxygen for a sustained gold price recovery.
Key Event to Watch
Friday's US Core PCE Price Index (June 20) is the week's main event for gold price direction. A hot inflation print would strengthen the dollar and likely push the gold price below $4,150; a downside miss could spark a relief rally toward the $4,250–$4,300 region. Position sizing must account for this binary risk — the PCE release has a track record of producing sharp intraday gold price swings.
How the Gold Price Affects Physical Buyers and Long-Term Investors
While short-term traders fixate on intraday gold price fluctuations, long-term investors and physical bullion buyers often view dips like this as strategic accumulation opportunities. When the gold price pulls back on geopolitical de-escalation — as it has following the US-Iran deal — the fundamental drivers of long-term gold demand (currency debasement, inflation hedging, and portfolio diversification) remain intact. For those looking to purchase physical gold coins and bars, a lower gold price directly improves entry cost and long-term upside potential.
Similarly, Shariah-compliant investors watching the gold price decline may find this an opportune moment to allocate through structured products. Halal gold trading platforms that offer zero swap fees and physical ownership allow participants to hold positions through gold price volatility without incurring overnight financing costs — a critical advantage when navigating choppy, range-bound conditions like today's Asian session.
Devil's Advocate
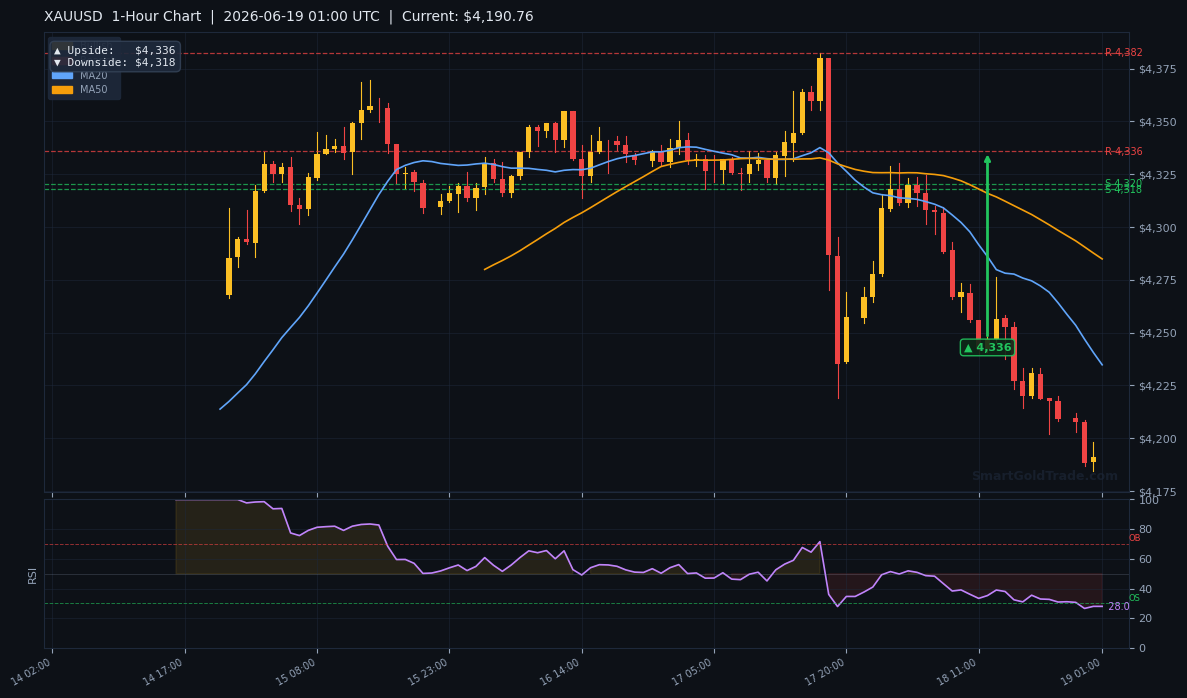
The bearish thesis unravels if the peace deal frays. Should congressional pushback or Iranian non-compliance reignite tensions, safe-haven bids would rush back into the gold price with force. A 4-hour close above the MA20 at $4,300.22 would flip the short-term bias from bearish to neutral. A subsequent reclaim of the $4,315 resistance-turned-support zone would target the 1-hour upside objective at $4,336. For now, the weight of evidence favors further gold price weakness, but disciplined traders must keep this invalidation scenario front of mind and respect their stops.
Trading Strategy for Asian Session
Entry for a short position could be placed on a retest of yesterday's intraday high near $4,200, with a stop-loss above the resistance cluster at $4,357 — roughly 1.5 times the ATR above entry. The first take-profit target sits at the 4-hour downside objective of $4,150, with a second target extending to $4,120 if bearish momentum persists through the London open.
Aggressive traders may consider shorting a clean break below $4,175 with a tighter stop at $4,200. For precise timing during these low-liquidity conditions, professional gold trading signals can help pinpoint entry and exit levels when the gold price moves on thin order books.
Remember, thin Asian markets can whip the gold price around unpredictably — use reduced position sizes and avoid overleveraging. Traders operating through Shariah-compliant platforms benefit from zero swap fees, making it structurally easier to hold positions overnight without cost drag eating into returns.
Key Takeaways
- Gold price opens Asian trade at $4,179.50, pressured below the key MA20 at $4,300.22 and all major moving averages.
- RSI at 37.0 still has room to fall, suggesting bearish momentum in the gold price is not yet exhausted.
- The $4,315 zone has flipped from support to resistance; a daily close below here confirms the breakdown and exposes $4,150.
- Resistance between $4,356.90 and $4,365.61 caps upside; intraday gold price rallies are likely to fade into this cluster.
- ATR of $29.42 points to a probable gold price range of $4,150 to $4,210 for today's session.
- Friday's US Core PCE release may dictate the next directional leg; position sizing must account for elevated event risk.
Conclusion
Gold price action on June 19 remains trapped below a wall of moving averages, with the RSI tilting bearishly and no immediate catalyst for a reversal. The US-Iran peace accord removed a major geopolitical tailwind, and the metal's failure to rally on a softer dollar confirms underlying weakness that sellers can exploit. Until bulls reclaim $4,300 on a daily closing basis, the path of least resistance for the gold price points toward the $4,150–$4,120 region. Asian liquidity may exaggerate intraday moves, so patience is essential. Set alerts near $4,175 and $4,315, and wait for London to validate the short setup before committing size.
FAQ
Why is the gold price falling despite the US-Iran peace deal?
The peace deal boosted risk appetite and reduced safe-haven demand for bullion. When geopolitical tensions ease, the gold price often retreats as capital rotates into risk assets — exactly the pattern unfolding this morning with the decline to $4,179.50. The softer US dollar failed to offset the risk-on sentiment, creating a bearish divergence that reinforces the downdraft.
What is the next key support level for the gold price?
With the $4,315 support zone now broken and acting as resistance, the next significant floor for the gold price sits in the $4,150–$4,160 region. Below that, the 4-hour chart structure points to $4,120 as a secondary objective if selling pressure accelerates through the European session.
Can the gold price recover above $4,300 this week?
A recovery above $4,300 would require a daily close above the MA20 — a tall order given the current fundamental backdrop. The RSI at 37 leaves some room for a technical bounce, but bullish catalysts are scarce before Friday's PCE data. A soft inflation print could spark a relief rally in the gold price, though the $4,315–$4,365 resistance cluster represents a formidable barrier to any sustained upside.
Risk Disclaimer: Trading Gold (XAU/USD) carries significant risk of loss and is not suitable for all investors. This content is for informational purposes only and does not constitute financial advice. Always conduct your own research and trade responsibly.