
Gold (XAU/USD) is trading at $4,213.53 as we enter the week of June 15, 2026, after a volatile period driven by inflation data and shifting rate expectations. This gold price forecast next week examines the technical landscape, the upcoming economic calendar, and data-backed trading scenarios to help you navigate the next five trading days with confidence.
Last Week in Review
Price Action Recap
Gold traded inside a $65 range last week, carving out a clear bottom near $4,180 and respecting the $4,240 area as resistance. Monday opened around $4,200 and early pressure forced a test of the weekly low at $4,175. Buyers stepped in aggressively around the 50-day moving average, pushing XAU/USD back above $4,210 by Wednesday. The weekly high was printed at $4,240 on Thursday before a mild pullback into the close at $4,213.53 — a flat finish that still preserved a constructive higher-low sequence compared to the prior week.
Key Events That Moved Gold
Two stories dominated the tape. The US CPI report on Wednesday showed core inflation at +0.3% month-over-month, slightly above the consensus estimate, which initially sent gold lower as rate-hike fears flickered. However, the move reversed within hours after dovish ECB commentary and soft eurozone industrial production reminded traders that global growth remains fragile. Secondly, a brief flare-up in Eastern European geopolitical tensions on Thursday triggered a classic safe-haven bid that propelled gold to its weekly high before profit-taking set in. A softening US Dollar Index (DXY) throughout the week provided an additional tailwind, keeping the gold price supported in dollar terms.
Weekly Close Analysis
The settlement at $4,213.53 is technically significant. It places gold above all three major daily moving averages: the MA20 ($4,195), the MA50 ($4,160), and the MA200 ($4,080). This layered alignment — short-term trend above intermediate and long-term trends — qualifies as a ‘bull market structure.’ The weekly candle printed a doji with a long lower shadow, indicating that sellers failed to hold the lows and buyers defended the MA50 zone aggressively. This sets a cautiously bullish tone heading into the new trading week.
Next Week Economic Calendar & Gold Impact
The June 15–19 week packs several high-volatility events, with the Federal Reserve taking center stage. The interplay between US data and the central bank’s messaging will determine short-term dollar direction and, by extension, gold’s path. Below is the key calendar traders should monitor closely; deviations from forecasts will drive the largest intraday swings.
| Day | Event | Forecast | Previous | Gold Impact |
|---|---|---|---|---|
| Tuesday | US Retail Sales (MoM) | +0.3% | +0.4% | HIGH. A strong print signals resilient consumption, boosting USD and pressuring gold. A miss revives recession chatter and supports gold. |
| Wednesday | FOMC Decision & Dot Plot | Hold (5.25-5.50%) | Hold | CRITICAL. Any hawkish shift in the dot plot (fewer cuts) lifts the dollar, bearish for gold. Dovish tone or cautious growth outlook weakens USD, bullish for gold. |
| Thursday | US Jobless Claims | 235K | 228K | MEDIUM. A jump above 250K would point to labor market softening, supporting gold as a hedge. In-line numbers keep focus on the FOMC aftermath. |
| Friday | Philly Fed Manufacturing | 4.0 | 2.5 | LOW-MEDIUM. An expansion above 10 could marginally strengthen USD, but Friday’s reaction is usually tempered ahead of the weekend. |
The Wednesday FOMC event is the linchpin. Markets are pricing in a near-certain hold, so the real fireworks will come from the Summary of Economic Projections (the dot plot) and Chair Powell’s press conference. Any hint that the committee anticipates only one cut in 2026 instead of two could force gold below the $4,200 handle, while a dovish lean that acknowledges cooling inflation might launch XAU/USD toward $4,260 and beyond.
Technical Analysis
Moving Average Structure
The current price of $4,213.53 sits firmly above the MA20 ($4,195), the MA50 ($4,160), and the MA200 ($4,080). The separation between the 20-day and 50-day averages is healthy, confirming that short-term momentum remains positive. Moreover, gold’s ability to hold above the MA200 for six consecutive weeks underscores the secular bull market. On any dip, these moving averages will act as dynamic support tiers, with the $4,160–$4,180 band being the must-hold zone for bulls.
RSI and Momentum
The 14-period daily RSI reads 58, tilting up from the mid-50s. This neutral-to-positive reading indicates there is ample room for further upside before overbought conditions emerge (typically above 70). The RSI has not reached extremes on either side, meaning momentum is steady rather than exhausted. A push above 60 would confirm building bullish momentum, while a drop below 50 would warn of a trend shift. The weekly RSI also supports a gradual uptrend, making the path of least resistance higher.
Key Support and Resistance Levels
Immediate resistance is at R1: $4,240 (last week’s high and a daily chart supply zone). A decisive close above this level opens the door to R2: $4,260, which aligns with a rising channel top from the May lows. The longer-term target for a breakout is around $4,285–$4,300.
On the downside, primary support is at S1: $4,180, which coincides with last week’s low and the MA50 area. Stronger support sits at S2: $4,150, representing the May swing low and a high-volume node. The daily Average True Range (ATR) stands at $28, projecting an average daily range of roughly $55–$65 when incorporating intraday volatility around news events.
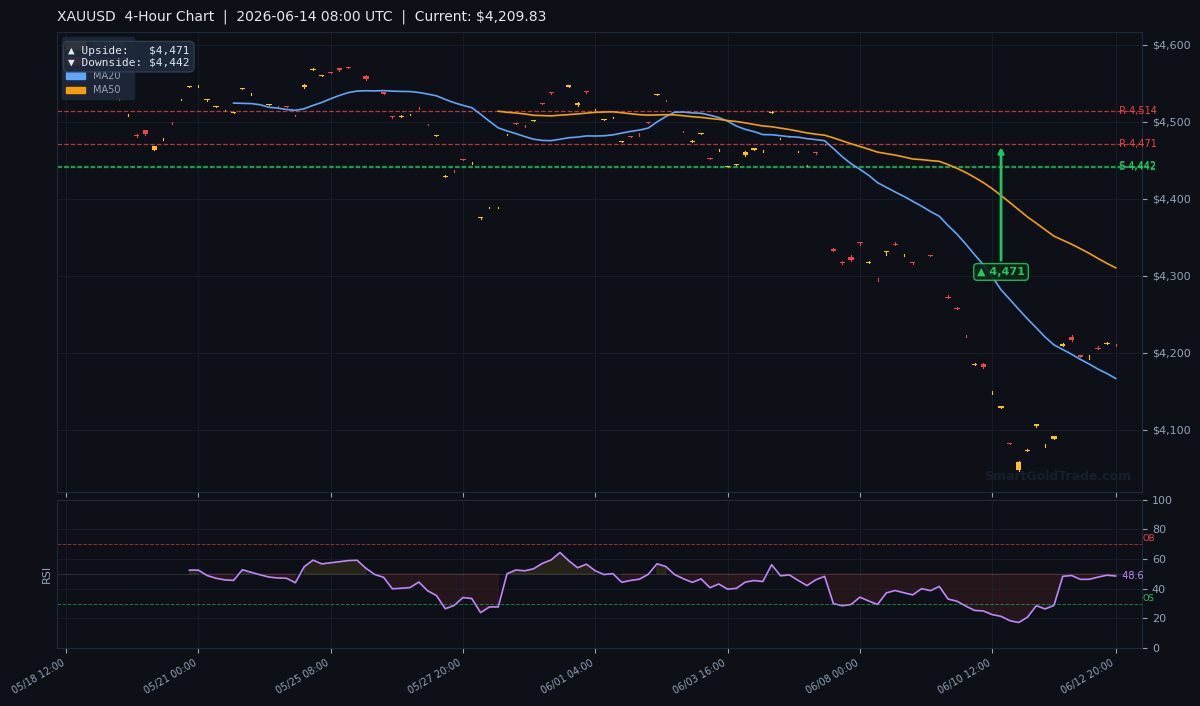
The 4-hour chart shows price consolidating in a symmetrical triangle, with the apex near the midweek FOMC event. A breakout in either direction should be sustained by the news catalyst. The $4,180–$4,200 cluster is the must-defend support for the bullish structure to remain intact.
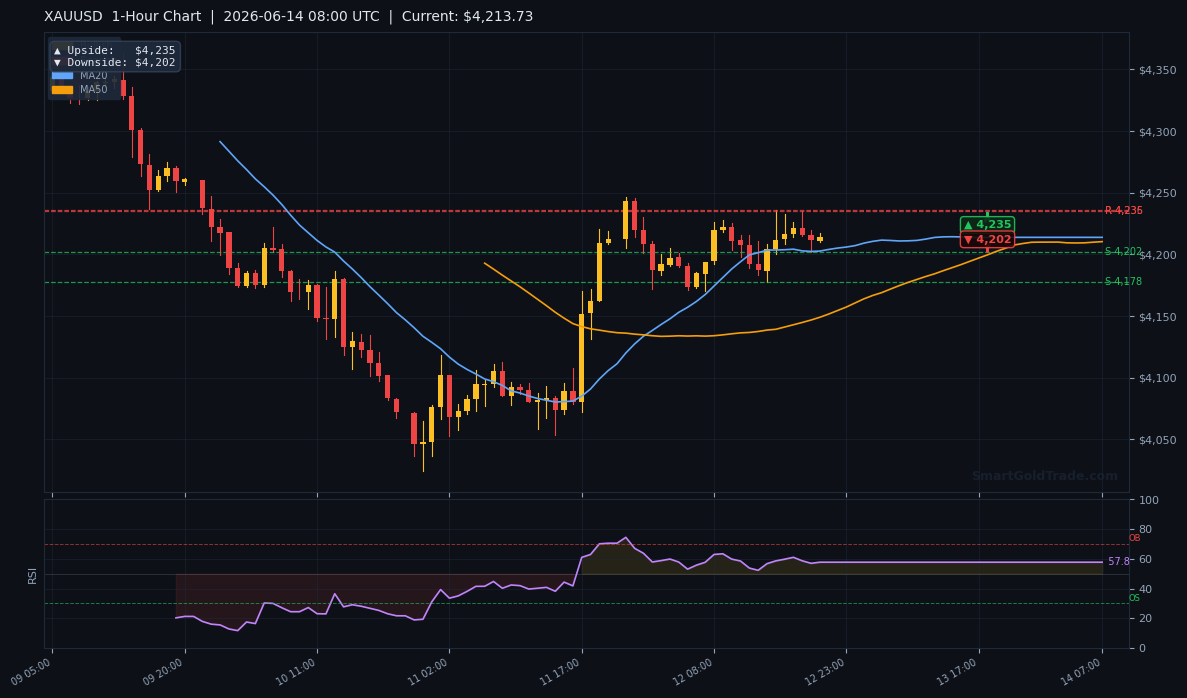
The 1-hour chart offers tighter levels: intraday resistance sits at $4,228 and $4,235, while short-term support is at $4,205 and $4,195. These pivots are ideal for fine-tuning entries on shorter timeframes.
Gold Price Forecast Next Week: Trading Scenarios
Bullish Scenario (Probability 55%)
Trigger: A sustained break and 1-hour close above $4,240, preferably catalyzed by a dovish FOMC stance or soft retail sales data. The combination of dollar weakness and safe-haven tailwinds would accelerate the move.
Entry Zone: A retest of the breakout area near $4,235–$4,240, or a bounce from the MA20 support at $4,195 after a shallow dip.
Primary Target: $4,260, followed by the channel top at $4,280.
Secondary Target: A psychological test of $4,300.
Stop Loss: Below the $4,210 swing low, ideally at $4,205.
Bearish Scenario (Probability 35%)
Trigger: Failure to hold above $4,200 and a breakdown below $4,180 (S1), driven by a hawkish dot plot or stronger-than-expected US Retail Sales. A loss of the MA50 support would open the floodgates for a rapid decline.
Entry Zone: A rejection candle from the $4,240 resistance, or a break below $4,178 with a retest of the level as new resistance.
Primary Target: $4,150 (S2), which aligns with the May low.
Secondary Target: A deeper pullback toward $4,100, near the psychological round number and prior consolidation zone.
Stop Loss: A 4-hour close back above $4,230 would invalidate the bearish setup.
Neutral / Range-Bound Scenario (Probability 10%)
If the FOMC delivers a perfectly balanced message and data prints come in exactly as forecast, gold may remain trapped between $4,180 and $4,240. In this environment, range-trading tactics apply: buying near $4,190 with a target of $4,230 and selling near $4,235 with a target of $4,195. The 1-hour chart pivots at $4,205 and $4,228 would serve as tactical entry points for this play.
For added precision, traders often supplement technical analysis with professional gold trading signals that provide real-time entry and exit alerts, helping to confirm high-probability setups around these key zones.
Risk Factors to Watch
Beyond the scheduled economic events, several external risks can reshape gold’s trajectory overnight. A sudden escalation in geopolitical hotspots — whether in the Middle East, Eastern Europe, or US-China trade relations — would immediately ignite safe-haven demand, overriding all technical models. Conversely, a rapid rise in real yields (if the market reprices a hawkish Fed path) could hammer non-yielding gold. Additionally, central bank buying patterns remain a wildcard; any sign that official sector purchases have slowed could remove a structural bid from the market.
Another key risk is positioning: the latest Commitments of Traders (COT) report shows speculative net-long positions near multi-month highs. While this reflects bullish sentiment, it also raises the danger of a sharp correction if those positions are unwound on a headline surprise. Prudent risk management, tight stops, and avoiding overexposure ahead of the Wednesday FOMC event are essential.
Market Sentiment and Institutional Flow
Gold-backed ETF holdings have ticked higher for three consecutive weeks, indicating steady institutional accumulation. Physical demand from major Asian hubs remains strong ahead of the wedding season, providing a demand floor. Options market skew shows a slight call premium for end-of-June expiries, suggesting professional traders are leaning toward further upside. These signals align with the bullish bias outlined in our gold price forecast next week, but they do not eliminate event-driven whipsaw risk.
FAQ
What factors influence the gold price forecast next week?
Central bank policy (especially the FOMC dot plot and Powell’s tone), US economic data like Retail Sales, inflation reports, and unexpected geopolitical developments are the primary drivers. The US dollar index and real interest rates dictate gold’s opportunity cost, so any shift in those variables directly impacts the forecast.
How do I use support and resistance levels for gold trading?
Support and resistance levels act as price zones where buying or selling pressure historically emerged. Traders often enter long positions near support ($4,180 in our forecast) with a stop below, and short positions near resistance ($4,240) with a stop above. Combining these levels with candlestick confirmation and volume analysis improves the odds of a successful trade.
Can I trade gold in a Shariah-compliant way?
Absolutely. Islamic finance prohibits riba (interest) and excessive uncertainty (gharar), which means conventional leveraged accounts or overnight swap charges are off-limits. A Shariah-compliant trading platform offers spot gold trading with immediate physical ownership and no interest, CFDs, or leverage. This ensures your gold trading aligns with Islamic principles while you benefit from price movements.
Whether you are an active trader or a long-term investor, precision and discipline remain your best allies. If you are building a weather-proof hedge, you can also purchase physical gold in certified coins and bars — a tangible asset that has preserved wealth for centuries. Keep an eye on the FOMC midweek, manage risk tightly, and let price action confirm your trades.