Gold price consolidates near $4,068 early in the European session on July 2, 2026, digesting a cautious overnight tone that left the metal trapped between the 1‑hour pivot targets of $4,054 and $4,074. Yesterday’s ISM manufacturing print slipped deeper into contraction territory, fanning recession whispers, while cross‑asset flows — notably the pound’s steady consolidation against the yen — signaled a market that is reluctant to commit ahead of this week’s marquee event. With London desks now coming online, a fresh jolt of liquidity is expected; the question is whether buyers can seize the moment and drive gold price towards $4,097 or if sellers will exploit any hesitation and drag it back to $4,054.
Gold Price Market Overview
Macro Context
The US Dollar Index hovers near 101.50, its lowest in three weeks, while 10‑year Treasury yields sit at 4.25% — a combination that typically gifts tailwinds to non‑yielding assets. Fed funds futures now price a 70% probability of a September rate cut, a shift that accelerated after last Friday’s durable goods miss and a downbeat consumer confidence reading.
Geopolitical anxiety continues to simmer beneath the surface: EU‑China trade frictions and fresh sanctions chatter on Russian gold reserves keep a safe‑haven bid alive. These macro currents create a fertile backdrop for gold price to push higher, provided the technical framework cooperates.
Session Outlook
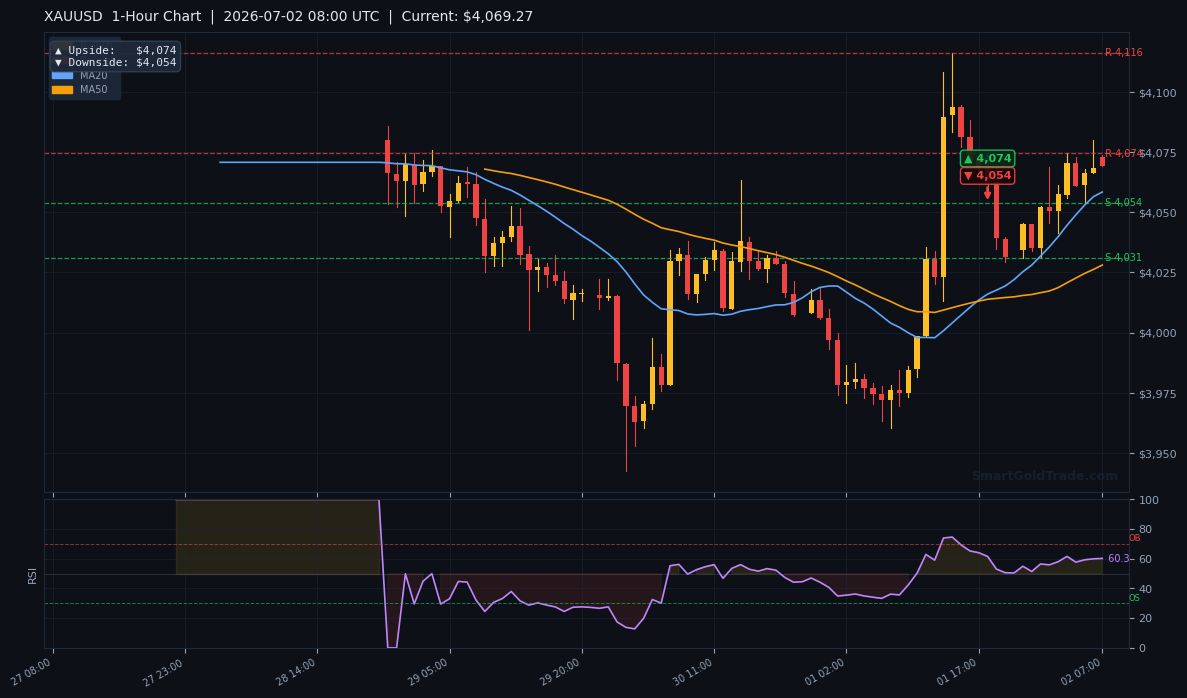
The European session tends to inflate volatility as institutional desks adjust risk; today’s opening gaps and early option expiries near $4,075 could serve as a catalyst. Markets expect an immediate range roughly bounded by the 1‑hour downside at $4,054 and the 4‑hour upside at $4,097 — a zone that has held through three consecutive sessions.
A sustained break above $4,074 (1‑hour high) would quickly shift attention to $4,097, while a drop below $4,054 exposes the 20‑period moving average at $4,029.08. With the Asian session providing little direction, all eyes turn to London’s reaction at the open to determine which side of the range will crack first.
Technical Analysis
Moving Average Structure
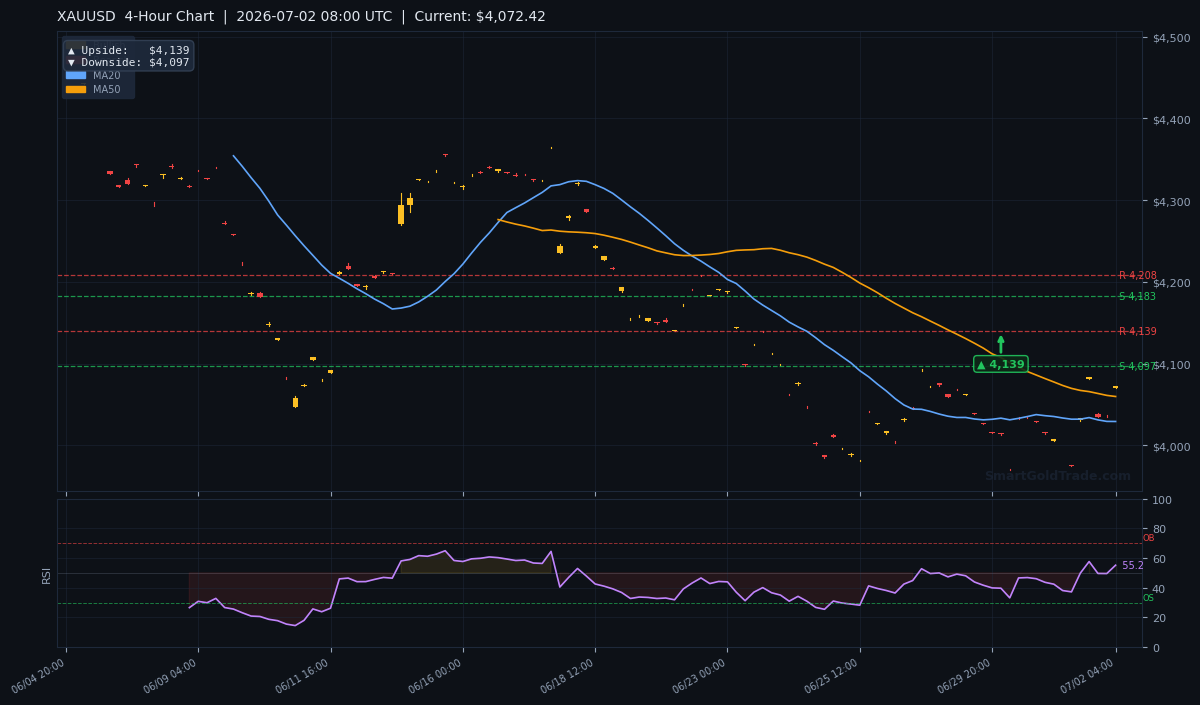
The 4‑hour chart paints a conflicted picture. Gold price trades at $4,068.21, comfortably above the 20‑period MA at $4,029.08 and the 50‑period MA at $4,059.65 — a short‑term bullish signal that indicates momentum favours buyers. However, the 200‑period MA towers at $4,310.99, leaving price firmly in longer‑term bear territory.
The EMA structure carries an important nuance: the 20‑period MA sits below the 50‑period MA. This alignment normally signals residual bearish pressure, yet the fact that price has climbed above both averages suggests the downtrend is losing traction. A bullish EMA crossover — where the 20‑MA pushes above the 50‑MA — would strengthen the buy case and likely propel gold price toward the $4,139 conflux.
RSI and Momentum
The 14‑period Relative Strength Index reads 55.2, sitting squarely in neutral territory. The oscillator has refused to breach overbought conditions during the recent bounce, leaving headroom for further upside.
Meanwhile, the Average True Range (14) stands at $26.65, implying a typical daily cradle of roughly $4,042–$4,095. With price currently near the middle of that band, momentum indicators neither scream buy nor sell — a consolidation signature that often precedes an explosive expansion move.
Key Price Levels
Derived from pivot data, support S1 is located at $4,182.58 and S2 at $4,139.90. With price trading beneath both, these have flipped into resistance zones, capping any rally attempt. On the flipside, resistance R1 is $4,207.82 while R2 sits at $4,139.37 — a fascinating convergence with S2 that turns the $4,139 handle into a pivotal battleground.
Below $4,068, the immediate floor is the 1‑hour downside target at $4,054, followed by the 20‑MA at $4,029.08. ATR‑based calculations place the session support near $4,042 and resistance near $4,095, reinforcing the tactical importance of the $4,054–$4,097 range.
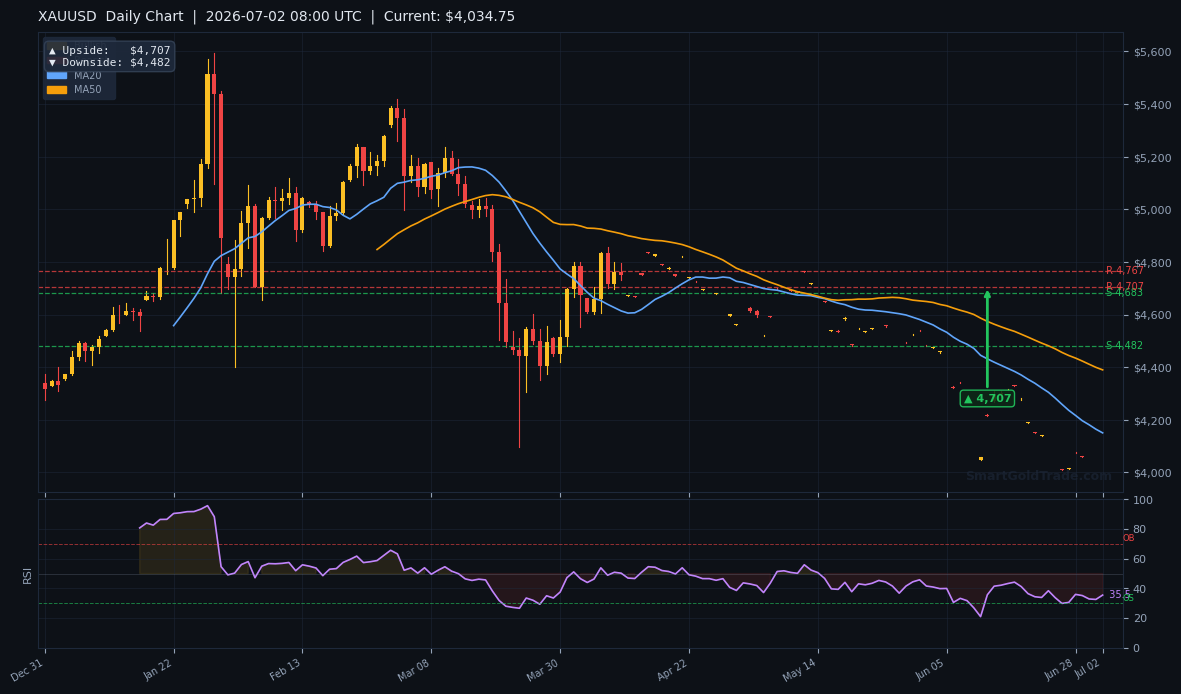
| Timeframe | Upside Target | Downside Target |
|---|---|---|
| Daily | $4,707 | $4,482 |
| 4‑Hour | $4,139 | $4,097 |
| 1‑Hour | $4,074 | $4,054 |
Fundamental Drivers
Cross‑asset tidings from Wednesday’s European session remain the most immediate guide. The British pound ground sideways against the yen as traders digested the two‑day rally, a cautious rotation that filtered into bullion and kept gold rangebound. When carry trades stall, precious metals often attract a short‑term safety bid, and that dynamic was evident yesterday.
Yesterday’s ISM manufacturing survey came in at 48.5, reinforcing the narrative of a cooling US industrial sector. Slumping new orders and employment sub‑indices stirred fears that the Federal Reserve may have to cut rates sooner rather than later — a scenario that historically lifts gold price. This economic fragility, combined with a soft DXY, places a tentative floor under gold, but the metal still needs a fresh catalyst to escape its multi‑session range. Meanwhile, any sudden rise in the 10‑year yield from 4.25% would quickly erode that floor.
Key Event to Watch
The June nonfarm payrolls report, due Friday morning, dominates the radar. Consensus anticipates 190,000 new jobs. A reading below 150,000 would likely turbocharge rate‑cut bets and could propel gold price beyond $4,097 toward the $4,139 pivot.
Conversely, a print above 250,000 — signaling hot labour markets — would embolden the Fed hawks, send yields spiking, and drag gold back toward the $4,029 moving‑average support. Until then, price action is likely to remain tethered to the ATR‑dictated band.
Devil’s Advocate
A break below the 1‑hour downside target of $4,054 would immediately undermine the bullish thesis. Paired with a slide beneath the ATR‑implied low of $4,046, such a move could trigger