Gold price drifted to $4,122.35 early Thursday, hovering just above short-term moving averages in a session starved of liquidity. The Asian open printed little more than a slow grind, with the metal barely extending Wednesday's tepid probe above $4,120.
Japanese yen flows dominated the FX complex after fresh intervention chatter nudged USD/JPY toward 162.45, offering the gold price a gentle bid but nothing explosive. This is a traders' market only for the patient. With US weekly jobless claims set for release later today, the Asian range is likely to hold unless a headline crosses the wires.
Gold Market Overview
Macro Context
The dollar is nursing modest losses across the board this morning, as fears of Japanese yen intervention keep the greenback on a leash. US 10‑year Treasury yields are holding near last week's settlement, offering no fresh catalyst for gold to break loose. The broader macro picture still leans on the Federal Reserve's higher-for-longer posture, but for now the market is repricing rate expectations almost entirely on incoming data — making every high‑frequency release a potential trigger.
Gold's correlation with real yields has tightened in recent sessions, meaning any dip in DXY or a soft jobless claims print could give the metal a swift lift. Yet with MA200 towering at $4,239.89, the long‑term trend remains bearish, keeping the bounce contained inside a larger structural decline.
Session Outlook
Asian hours are notoriously thin in late‑summer conditions, and with Tokyo on intervention watch, gold is likely to chop between $4,119 and $4,134. Breakout attempts before London opens typically retrace unless backed by a shock headline. I would rather sit on hands and wait for a confirmed rejection at $4,134 or a clean hold above $4,120 before committing capital.
Liquidity will improve only when European desks switch on, but even then, the reaction to US claims data will dictate the real move. Until that trigger, treat any sudden spike with skepticism — chasing price in a half‑empty market is the quickest route to a stop‑hunt.
Technical Analysis
Moving Average Structure
The MA20 (short) at $4,111.76 and the MA50 (medium) at $4,095.23 sit well below current price, confirming a short‑term bullish alignment. The gold price trading above both averages is the first piece of evidence that momentum has shifted off the recent lows. However, the MA200 at $4,239.89 casts a long shadow — a break back above it is required to declare the downtrend over.
This structure tells a story of a counter‑trend rally inside a bearish channel. The MA20 > MA50 cross suggests buyers have enough conviction to defend dips, but they are still operating under the ceiling of the 200‑period line. In practice, that means rallies can run into heavy overhead supply fast.
RSI and Momentum
The 14‑period RSI reads 52.8, squarely in neutral territory. It has not yet touched overbought levels, leaving room for a further leg higher without the usual exhaustion warning. If the RSI can push above 60 on a 4‑hour close, it would confirm that buying pressure is genuine, not just short‑covering.
For intraday traders, this neutral reading is an invitation to wait. Momentum is not yet stretched in either direction, so jumping early often means getting caught in the vacuum of the Asian range.
Key Price Levels
The indicator panel reveals a somewhat unusual configuration: Support S1 at $4,164.51 and Support S2 at $4,147.61 now lie above the spot price, suggesting these former floors have flipped into overhead resistance. A sustained break above $4,164.51 would be the first signal that bulls are reclaiming lost ground.
On the upside, Resistance R1 stands at $4,184.32 with R2 at $4,181.55, creating a tight resistance cluster just shy of the 4‑hour upside target. The daily ATR(14) of $20.91 implies a typical session range of roughly $4,101 to $4,143, so moves beyond these boundaries would signal abnormal volatility.
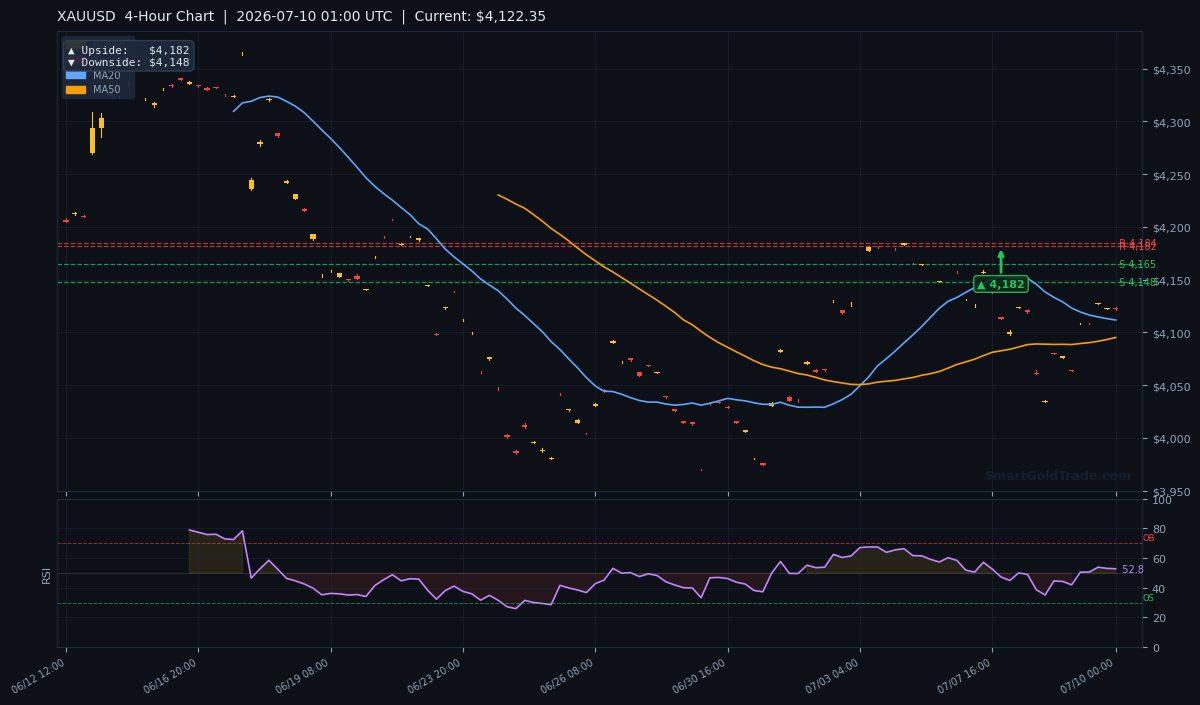
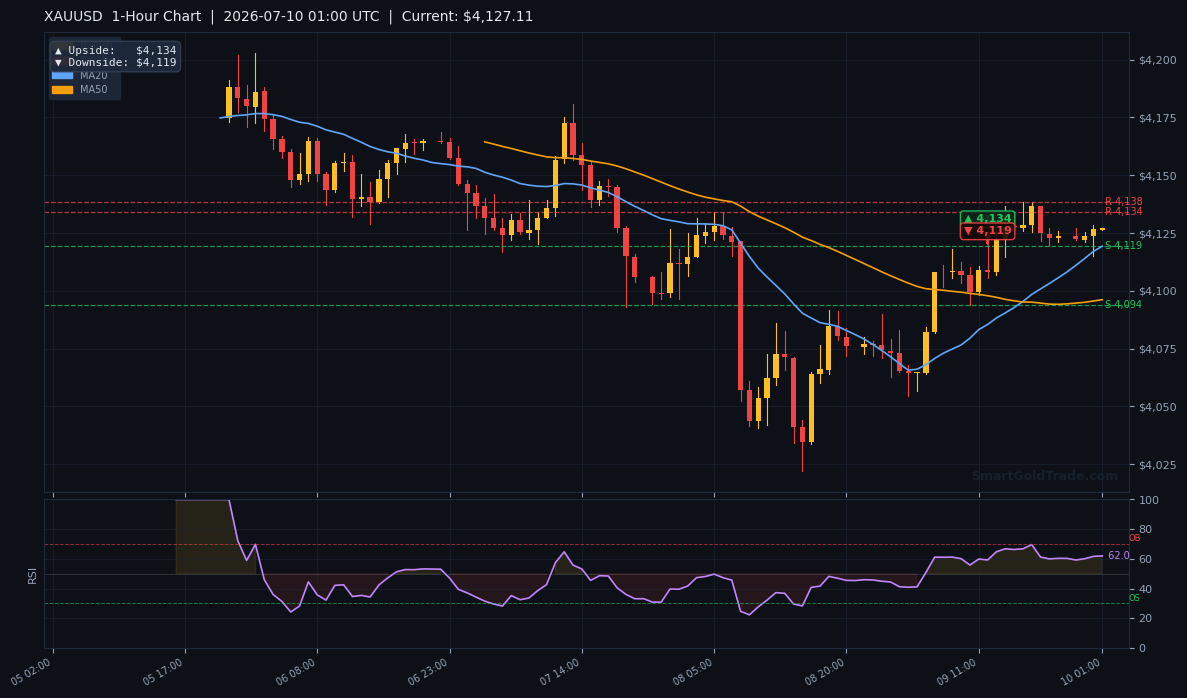
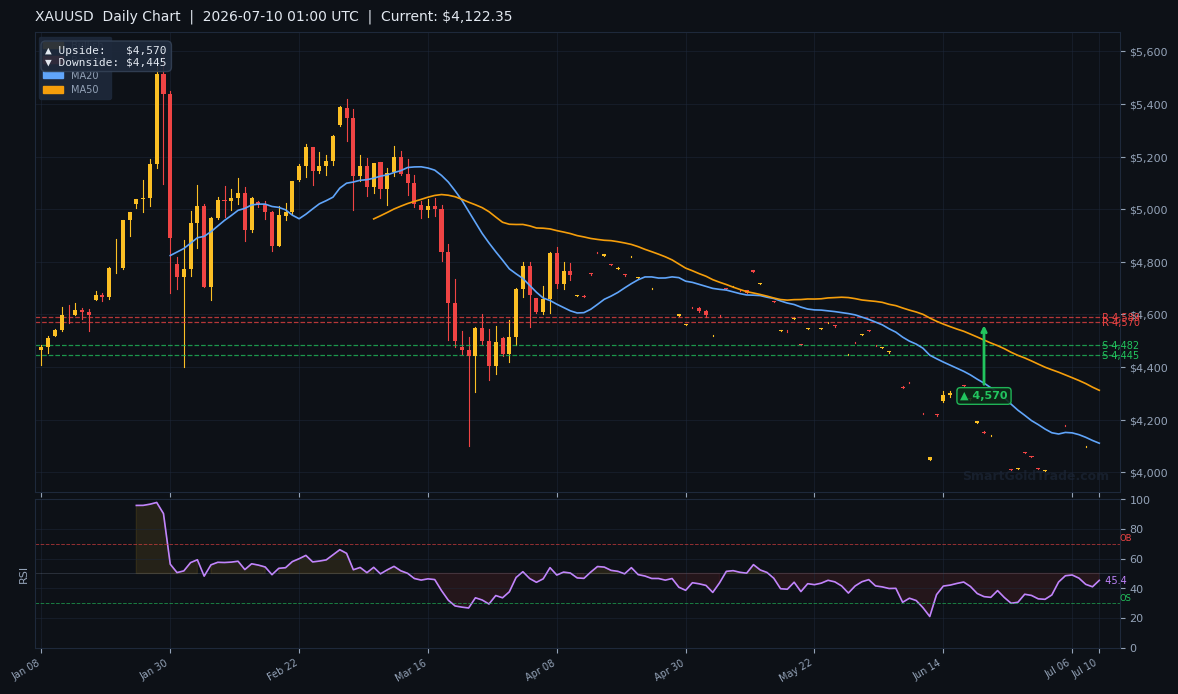
The multi‑timeframe pivot targets further refine the roadmap. The daily chart points to an ultimate upside of $4,570 if the bullish structure holds, while the immediate 1‑hour and 4‑hour arrows suggest more realistic short‑term objectives.
| Timeframe | Upside Target | Downside Target |
|---|---|---|
| Daily | $4,570 | $4,445 |
| 4‑Hour | $4,182 | $4,148 |
| 1‑Hour | $4,134 | $4,119 |
Fundamental Drivers
The yen is the quiet driver this session. Japanese authorities are once again dropping verbal warnings about speculative moves, pushing USD/JPY toward 162.45 and injecting a bid into safe‑haven assets. Gold has historically caught a tailwind when the yen strengthens sharply, though the correlation is far from perfect. Still, this morning's move explains why gold is holding above $4,120 despite an otherwise uneventful calendar.
The real test comes later today when the US releases weekly initial jobless claims. A print above consensus would reinforce the narrative of a softening labour market and could push gold through $4,134. Conversely, a strong number would likely send the dollar higher and test the bull's resolve near $4,111.
Key Event to Watch
US weekly jobless claims at 12:30 UTC is the most important risk event of the day. A surprise below 220k would embolden dollar bulls and could drag gold back to the MA20 floor. An above‑expectation reading, especially if it touches 250k or higher, would likely fuel a quick spike toward $4,134 resistance. Plan your risk around this release, not before it.
Devil's Advocate
A false breakout is the primary risk to the bullish thesis. If gold tags $4,134 but fails to close above it on a 1‑hour basis, short‑term momentum will reverse and likely send price back toward $4,119. A daily close below $4,095 — the MA50 level — would completely invalidate the counter‑trend rally and open the door to the $4,070 zone.
Moreover, the placement of former support at $4,164.51 now acting as resistance means any recovery must grind through a thick layer of overhead supply. The path lower is cleaner, and patient bears are simply waiting for the Asian‑session buyers to exhaust themselves.
Trading Strategy for Asian Session
I see a high‑probability long setup only on a retest of the $4,118–$4,122 zone, which aligns with the 1‑hour downside target and the current MA20 vicinity. An entry in this area with a stop at $4,100 keeps risk within a single ATR and offers a true reward‑to‑risk ratio above 1:2 when targeting $4,134.
For traders who prefer cleaner confirmation, waiting for a 4‑hour close above $4,134 opens the path to $4,182. Under no circumstances should anyone chase a pop above $4,134 in the current thin liquidity — the first touch is almost always faded. Those who already hold physical gold or participate in interest‑free spot gold trading can use this range to scale into a long bias, but sizing must be conservative until London steps in.
Long‑term investors using mudarabah investment plans can also accumulate on dips, but they should still watch the $4,119 level as a key line in the sand. If the jobless claims data prints favourably for gold, the move will be fast. Having a pending limit order near $4,115 with a hard stop at $4,100 and a take‑profit at $4,134 is a simple, rules‑based approach that avoids emotional decisions. Using professional gold trading signals can also help pinpoint exact entry timing when news hits, but never abandon your own stop discipline.
Key Takeaways
- Gold price is building short‑term bullish momentum above $4,111.76 (MA20) and $4,095.23 (MA50).
- The $4,134 1‑hour target is the immediate hurdle — a close above it opens $4,182.
- Former support at $4,164.51 now acts as resistance; bulls must reclaim this level to gain conviction.
- RSI at 52.8 leaves room for upside, but a break below $4,119 would kill the momentum play.
- The daily ATR of $20.91 suggests a typical range of $4,101–$4,143, don't overstay outside it.
- US jobless claims later today are the session's main volatility event — trade the reaction, not the anticipation.
Conclusion
The chart reflects a market that has found a tentative floor but is still wrestling with a long‑term bearish structure. Holding above $4,120 and the MA20 gives bulls a narrow edge, yet without a clean break of $4,134, the upside remains a promise, not a delivery. Asian‑session traders should treat this as a preparation window, not an execution hall.
I maintain a cautiously bullish bias while price respects $4,119 support, but I will not hesitate to flip neutral if the US data or a dollar rally drives gold below $4,095. The next 24 hours are about discipline — let the levels, not the noise, dictate your decisions.
Frequently Asked Questions
- What is the outlook for gold price in today's Asian session?
- Gold is likely to oscillate between $4,119 and $4,134 as thin liquidity limits momentum. A breakout is unlikely before US jobless claims, so wait for a confirmed signal near these boundaries.
- Where is the best entry zone for a long trade?
- A buy opportunity near $4,118–$4,122 offers a strong risk‑reward profile, with a stop below $4,100 and an initial target at $4,134.
- What would invalidate the bullish short‑term view?
- A 1‑hour close below $4,119 or a breach of the MA50 at $4,095.23 would signal exhaustion and likely trigger a drop toward $4,070.