Gold price opens the European session at $4,191.69, a modest recovery from the critical $4,171 support that held during the earlier selloff triggered by last week's hawkish Fed repricing. The U.S. dollar remains buoyant as traders brace for another round of Federal Reserve commentary, keeping XAU/USD under pressure near multi-week lows. Yet beneath the surface, an emerging EMA crossover and neutral RSI readings hint at a possible intraday bounce. The London open will test whether bulls can reclaim $4,208 or if bears extend losses toward $4,235.
Gold Market Overview
Macro Context
The U.S. Dollar Index (DXY) is holding firm above 105, while the 10-year Treasury yield remains north of 4.5%, reflecting last week's hawkish FOMC decision that pushed rate-cut expectations further into 2027. This macro backdrop continues to weigh on gold price, as higher yields increase the opportunity cost of holding the non-yielding metal. Additionally, easing geopolitical tensions following the US-Iran peace deal have trimmed the safe-haven bid that had previously cushioned XAU/USD. Traders now question whether gold can find a floor without a fresh catalyst.
Session Outlook
European liquidity typically injects volatility into gold price as London desks adjust positions. With no high-tier economic data on today's calendar, the session will be driven by technical levels and U.S. dollar sentiment. The immediate focus is whether $4,171 can hold against bearish pressure. A break below would likely trigger stop-loss orders, accelerating a move toward the 4-hour downside target of $4,235. Conversely, any bounce fueled by the EMA crossover could carry gold price toward $4,208 resistance.
Technical Analysis
XAU/USD is trading at $4,191.69 as European desks settle in, recovering from the $4,171.69 overnight low but still below all major moving averages — a structurally bearish stance. The ATR(14) indicates an expected daily range of roughly $23.38, giving today's session a probable window between $4,148.31 and $4,195.07. With an ATR of $23.38, traders should set stops at least $24 away from entry to avoid being prematurely stopped out by normal market noise — a critical nuance when trading the gold price during European hours. The interplay between a bearish price location and a budding bullish EMA structure makes this a high-stakes session.
Moving Average Structure
The 20-period MA sits at $4,238.56 and the 50-period MA at $4,232.17, both well above the current price — confirming short‑ and medium‑term bearishness. The 200-period MA at $4,460.80 reinforces the broader downtrend. However, the EMA structure reveals MA20 > MA50, a nascent golden cross that points to short‑term bullish momentum. This contradiction suggests the selloff could be maturing and a dead‑cat bounce may be imminent if price can reclaim key levels.
Traders often view a golden cross as an early signal that momentum is shifting from bearish to bullish, even when the broader trend remains negative. This divergence makes the next few sessions crucial — if the gold price can capitalise on the bullish EMA structure and push above $4,208, a sustainable recovery could unfold.
RSI and Momentum
The RSI(14) reads 39.4, squarely in the neutral territory but leaning toward the lower boundary. It is not yet in oversold territory, meaning the bearish leg still has room to extend. A push below 30 would signal capitulation, while a break above 50 would confirm building bullish momentum. For now, the reading supports a cautious, range‑bound approach.
Key Price Levels
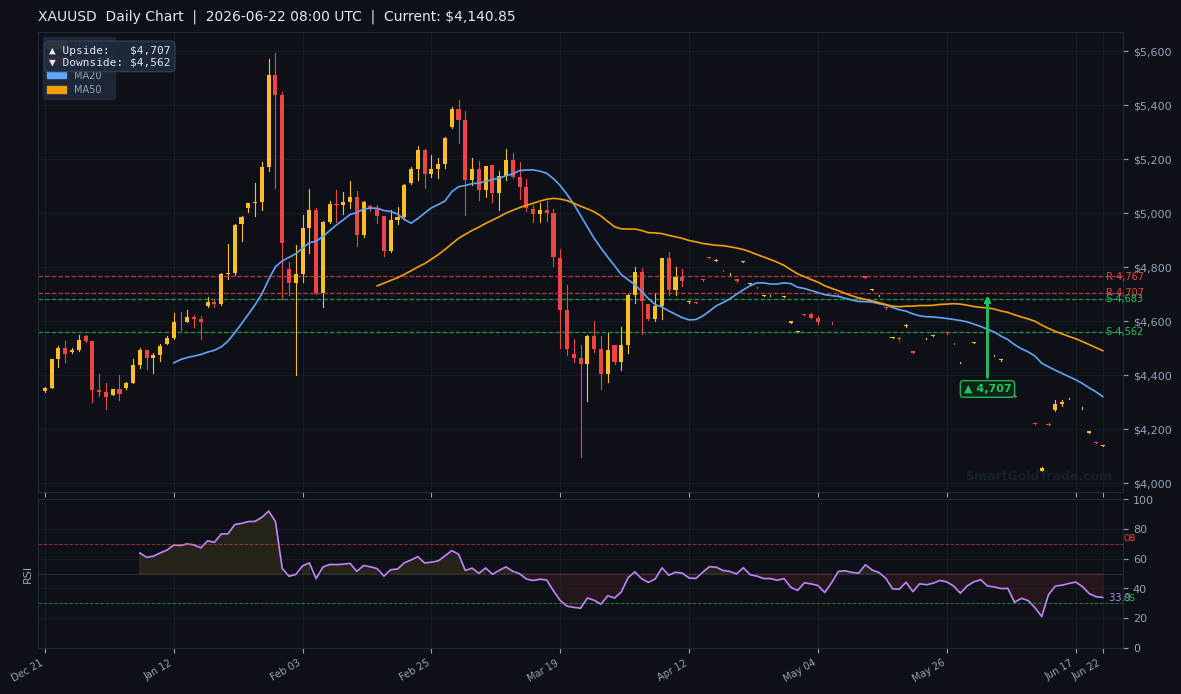
Overhead resistance lies at $4,365.61 (R1) and $4,356.90 (R2), levels that previously acted as support but have now flipped to resistance after last week's breakdown. Immediate intraday support is pegged at $4,315.62 (S1) and $4,313.77 (S2), though price is currently trading well below these zones, making them distant recovery targets. The table below outlines the pivot‑derived targets from multiple timeframes.
| Timeframe | Upside Target | Downside Target |
|---|---|---|
| Daily | $4,707 | $4,562 |
| 4-Hour | $4,357 | $4,235 |
| 1-Hour | $4,208 | $4,171 |
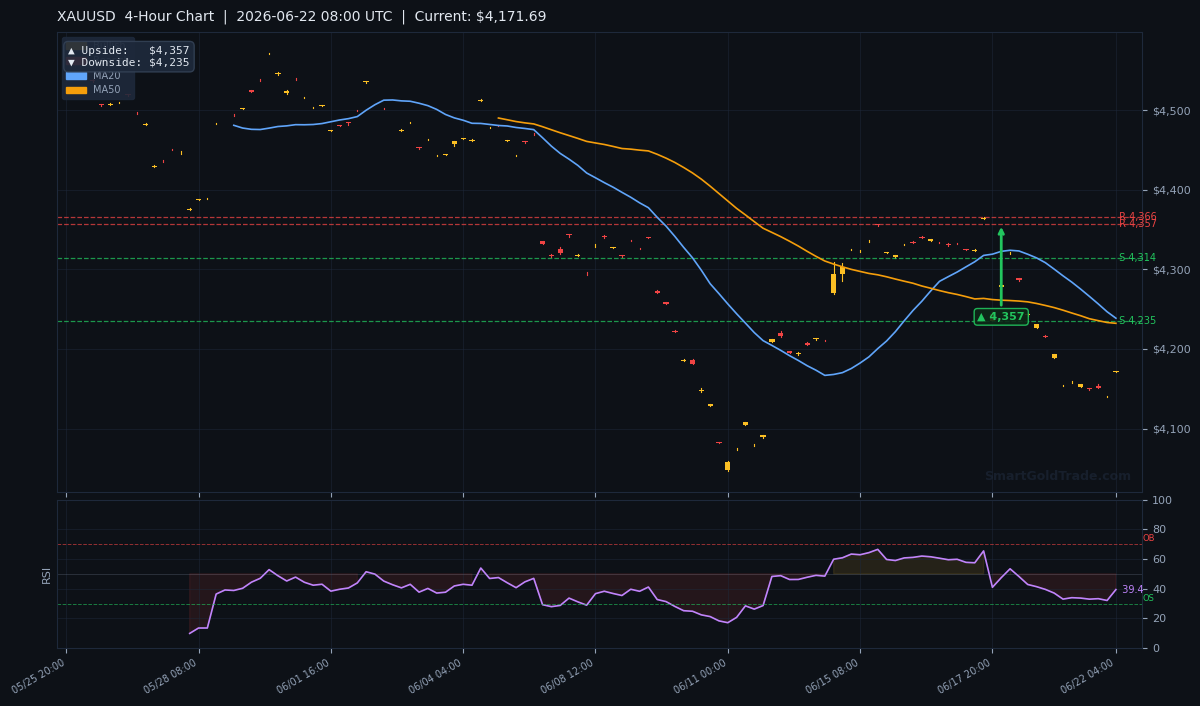
The 4-hour chart shows gold price trapped under the former $4,315 support zone, now a stiff resistance. A confirmed close above $4,235 would be the first bullish signal, but the path of least resistance remains lower until that level is reclaimed.
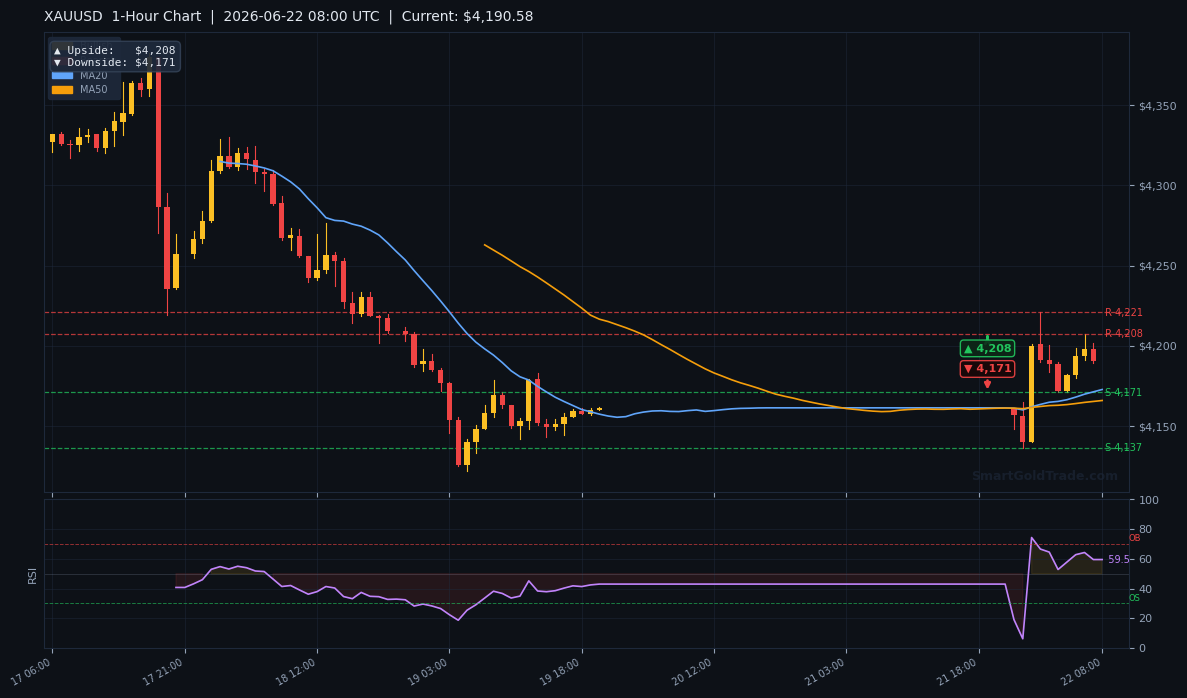
The 1-hour chart highlights the immediate tug-of-war at $4,171. A break below opens the door to the psychological $4,150 handle, while a bounce targets $4,208, aligning with early European resistance.
Fundamental Drivers
Last week's FOMC decision delivered a hawkish hold, repricing the market's rate trajectory and lifting both the dollar and Treasury yields. This repricing has been the primary headwind for gold price, overwhelming any supportive geopolitical headlines. The US-Iran peace deal further diminishes safe-haven flows, leaving gold vulnerable unless new tensions emerge. For now, the fundamental picture aligns with the technical bearishness: higher yields and a strong greenback offer little reprieve for bullion. On a positive note, central bank gold purchases remain elevated, providing a structural bid under the gold price that could contain any sharp move below $4,150.
Key Event to Watch
Friday's release of the U.S. core PCE inflation data — the Fed's preferred gauge — will be the week's pivotal event. A softer-than-expected print could revive hopes of an earlier rate cut, weakening the dollar and lifting gold price from its lows. Conversely, a sticky reading would reinforce the hawkish stance and likely push XAU/USD below $4,150.
Devil's Advocate
A recapture of the $4,315 resistance zone, accompanied by strong volume, would invalidate the bearish thesis and trigger a sharp short-squeeze toward the $4,357 4‑hour target. If the EMA golden cross matures and the RSI pushes above 50, buyers could regain control quickly. The bearish bias holds only if gold price remains below $4,208 on any bounce. A daily close above that level would flip the intraday outlook to cautiously bullish.
Trading Strategy for European Session
The primary play is to sell rallies into the $4,208 resistance zone. An entry in the $4,195–$4,208 region offers a favourable risk‑reward, with a stop loss above $4,235 (the 4‑hour downside target now acting as resistance) and a take‑profit target at $4,171, followed by $4,150.
For traders engaging in halal gold trading with physical ownership and no leverage, this setup translates to scaling into short positions on strength while adhering to spot market discipline. If price holds $4,171 and forms a bullish reversal candle, an aggressive long with a tight stop below $4,145 can target $4,208. However, the broader trend favours the short side until the dollar shows clear signs of topping. For real-time entry precision, professional gold trading signals can help navigate the European volatility.
Physical Gold and Halal Investors
While intraday traders focus on the $4,171–$4,208 range, long‑term Shariah‑compliant investors often use these gold price pullbacks to add physical gold to their portfolios. SmartGoldTrade’s store offers 22K coins, 24K bars, and gold jewelry, making it easy to purchase physical gold when the gold price tests key support levels. This approach aligns with the Islamic principle of owning tangible assets, providing a hedge against currency debasement without resorting to interest‑based instruments.
Key Takeaways
- Gold price is testing critical $4,171 intraday support as European session opens, with a modest recovery to $4,191.69.
- EMA structure (MA20 above MA50) hints at a short‑term bullish reversal despite bearish price location.
- RSI at 39.4 is neutral, leaving room for either a bounce or continued selloff.
- Overhead resistance at $4,208 (1-hour) and $4,235 (4-hour) must be cleared for bulls to gain confidence.
- Friday's core PCE data will be the make‑or‑break event for the gold price this week.
- ATR of $23.38 suggests a session range of approximately $4,148 to $4,195.
Conclusion
Gold price enters the European morning at $4,191.69, having defended the $4,171 support, with the dollar's post‑FOMC strength dictating the tempo. The bearish undercurrent remains dominant as long as price trades below the $4,315 resistance zone, but the embryonic EMA golden cross warns of potential bounces. The most likely scenario sees a test of $4,208 resistance before sellers re‑emerge. A breakdown below $4,171 shifts the immediate target to $4,150. Patience through today's European flows will be rewarded, with the larger directional move likely waiting for Friday's inflation data.
FAQ
What is the gold price right now?
As of 08:30 UTC on June 22, 2026, XAU/USD trades at $4,191.69 per troy ounce, with the critical intraday support at $4,171 holding.
What are the key support levels to watch?
The immediate floor is $4,171, followed by the 4-hour downside target at $4,235 and the psychological $4,150 handle.
Is gold price bullish or bearish today?
The broader trend is bearish with price below all major moving averages, but a short-term EMA crossover suggests a potential bounce toward $4,208.
Trading Gold (XAU/USD) carries significant risk of loss and is not suitable for all investors. This content is for informational purposes only and does not constitute financial advice. Always conduct your own research and trade responsibly.