Gold opens the new trading week at $4,161.16 per troy ounce on Sunday, June 21, 2026, as markets digest a week of hawkish Federal Reserve rhetoric, renewed US Dollar strength, and a brief geopolitical flare-up in the Middle East. This gold price forecast next week maps the technical landscape, dissects the economic calendar, and outlines actionable scenarios for the June 21–27 period.
Last Week in Review
Price Action Recap
Gold started the prior week near $4,267 and immediately faced selling pressure. By Tuesday, XAU/USD printed a session high at $4,290, but that level proved fleeting as hawkish Federal Open Market Committee (FOMC) commentary filtered into the market.
The metal cascaded lower through Wednesday and Thursday, with the sell-off intensifying after a surprise geopolitical headline—Iran closing the Strait of Hormuz amid an alleged ceasefire violation—momentarily lifted prices only to be faded aggressively. Gold bottomed at $4,098 on Thursday, marking the lowest level since early June. Friday brought a modest recovery to $4,161.16, leaving a weekly candle with a pronounced lower shadow but an overall bearish close.
Key Events That Moved Gold
Last week’s price action was driven by two dominant forces: Fed policy expectations and brief safe-haven demand. First, multiple Fed officials reinforced the narrative that rate hikes remain on the table, pushing market-implied probabilities of a July increase higher. This sent the US Dollar Index sharply upward, making dollar-denominated gold more expensive for foreign buyers.
Second, the Iran-Hormuz incident created a knee-jerk spike in bullion, but the rally quickly reversed as traders remembered that gold has been answering to the Fed, not geopolitical fear, throughout 2026. City Index UK and FXStreet both reported that hawkish Fed signals limited the upside for gold, a theme that dominated headlines.
Weekly Close Analysis
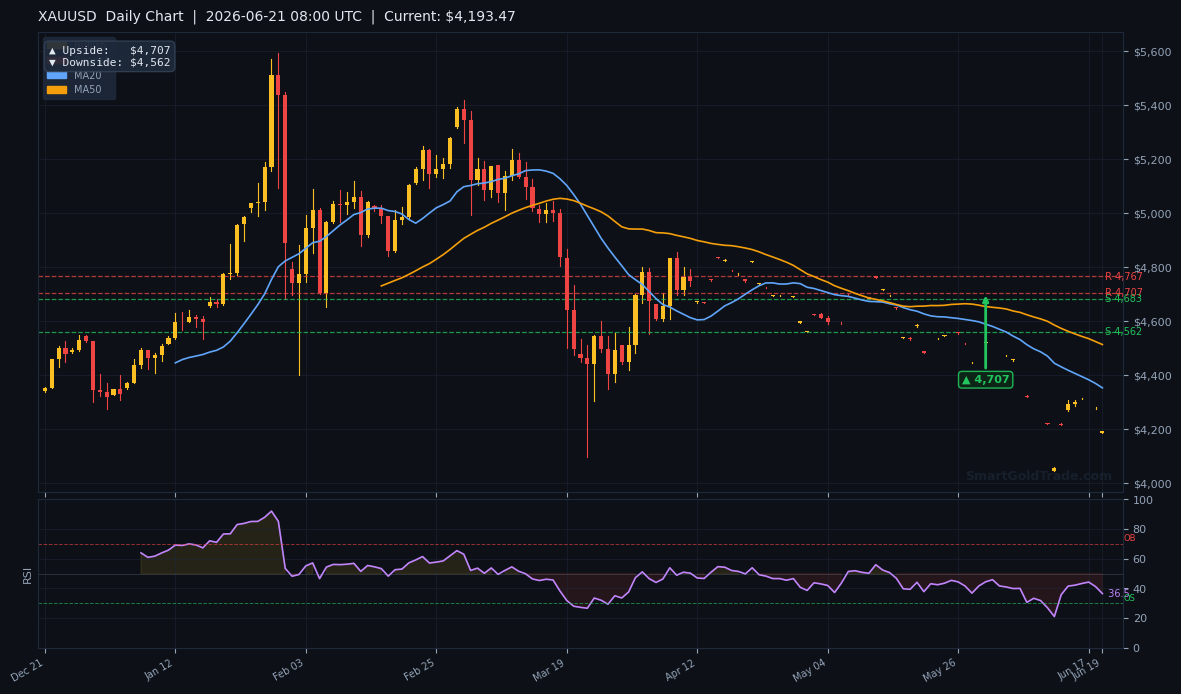
The weekly close at $4,161.16 left gold below both the 20-week and 50-week moving averages, reinforcing the medium-term bearish structure. Prices settled beneath the psychological $4,200 barrier and the former support-turned-resistance zone near $4,315.
A bearish engulfing or long upper shadow formation on the weekly chart underscores the rejection from higher levels. While the sharp bounce from $4,098 produced a noteworthy lower wick, the failure to reclaim $4,200 reinforces our gold price forecast next week being tilted to the downside.
Gold Price Forecast Next Week: Economic Calendar & Impact
The week ahead is packed with high-impact US economic releases and a key testimony from Federal Reserve Chair Powell. With the hawkish repricing of Fed policy still underway, incoming data that exceeds forecasts will reinforce a risk-off, pro-dollar environment, pressuring gold. Conversely, any downside surprises in growth or inflation figures could spark a dovish recalibration and provide a much-needed reprieve for XAU/USD.
| Day | Event | Forecast | Previous | Gold Impact |
|---|---|---|---|---|
| Mon, Jun 22 | ECB President Lagarde Speech | — | — | Hawkish ECB tone supports EUR/USD, mildly bullish for gold |
| Tue, Jun 23 | US New Home Sales (May) | 728K | 734K | Beat strengthens USD, bearish; miss lifts gold |
| Wed, Jun 24 | US Durable Goods Orders m/m (May) | 0.4% | 0.6% | Above forecast hawkish; below forecast supports gold |
| Wed, Jun 24 | Fed Chair Powell Testimony | — | — | Hawkish remarks sink gold; dovish tone would trigger relief rally |
| Thu, Jun 25 | US Final GDP q/q (Q1) | 1.6% | 1.4% | Stronger GDP boosts rate-hike bets, bearish; weaker growth lifts gold |
| Thu, Jun 25 | US Weekly Jobless Claims | 242K | 238K | Higher claims weaken USD, bullish; lower claims bearish for gold |
| Fri, Jun 26 | Core PCE Price Index m/m (May) | 0.2% | 0.3% | Lower inflation print would be dovish gold-positive; higher print bearish |
| Fri, Jun 26 | Revised UoM Consumer Sentiment (Jun) | 58.2 | 58.0 | Upside surprise adds pressure on gold; miss helps XAU/USD |
Our gold price forecast next week hinges heavily on the midweek Powell testimony and Friday's Core PCE reading. A hot Core PCE figure above 0.3% would likely push gold toward the lower end of its range. Should inflation cool faster than expected, gold could attempt to reclaim $4,200 and challenge overhead moving averages.
Technical Analysis
Moving Average Structure
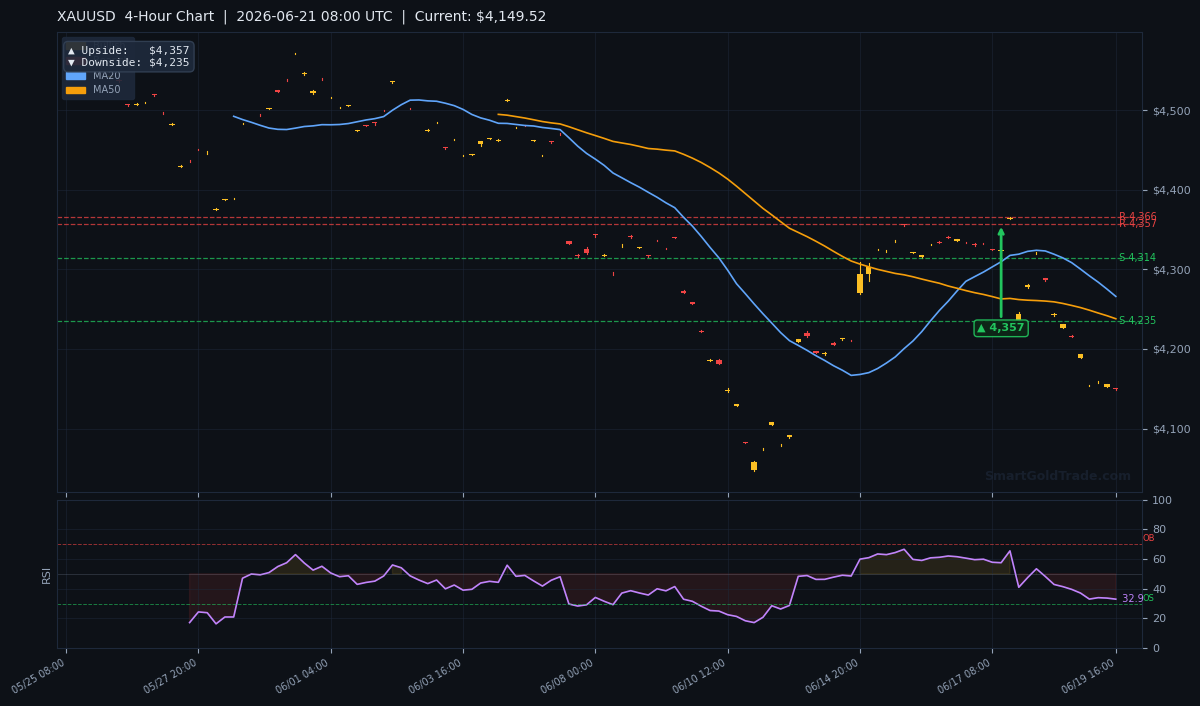
The 4-hour chart paints a conflicted picture. Gold trades at $4,149.52, below the short-term MA20 ($4,265.94), medium-term MA50 ($4,237.89), and long-term MA200 ($4,468.82). This configuration places XAU/USD decisively in bearish territory.
However, the EMA structure reveals that the MA20 remains above the MA50, signifying that the short-term trend still holds a bullish orientation despite the recent sell-off. This divergence often occurs during corrective pullbacks within a broader uptrend, but the price’s failure to reclaim either moving average keeps immediate risks tilted to the downside.
In line with our gold price forecast next week, the bearish bias persists as long as prices stay below $4,200.
RSI and Momentum
The 14-period Relative Strength Index stands at 33.0, hovering in the lower neutral zone but not yet reaching the oversold threshold of 30. This reading indicates that bearish momentum persists, yet the market is not stretched to the point where a sharp reflexive bounce is statistically favored. A push below 30 would signal capitulation selling and potentially set up a mean-reversion trade; until then, momentum remains with the bears.
Key Support and Resistance Levels
Given the Average True Range (ATR) of $32.30 over the last 14 periods, the expected weekly fluctuation is approximately $65–$80. Applying the ATR to the current price yields a probable range of $4,085 to $4,230 for the week ahead, with extremes possible around $4,070 and $4,250 during high-impact news.
Critical levels based on the latest pivot analysis are:
- Supports: S1 at $4,315.62, S2 at $4,313.77 (both above current price and acting as upside targets should buyers regain control). The more relevant near-term support is the 1-hour downside target at $4,143, followed by the psychological $4,100 mark and the June 18 low at $4,098.
- Resistances: R1 at $4,365.61, R2 at $4,356.90—these represent the ultimate ceiling for any recovery. Closer resistance stands at the 1-hour upside target of $4,179 and the 4-hour downside target of $4,235 (often a flip level). A sustained break above $4,235 opens a path to the $4,315–$4,357 zone.
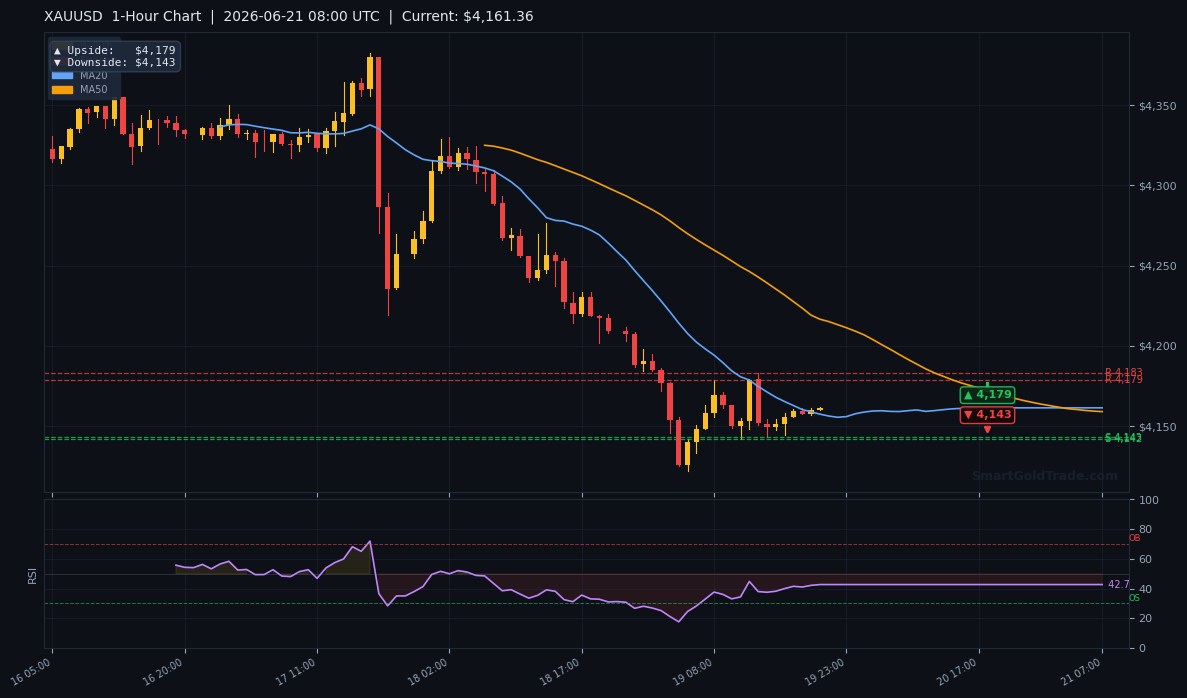
The daily chart’s projected targets sit at $4,707 on the upside and $4,562 on the downside. While these longer-term levels appear distant, they remind traders that the macro structure still contains the potential for a large breakout once the current consolidation resolves. For now, the tactical battle is at $4,143 and $4,179 on the lower timeframes.
Gold Price Forecast Next Week: Trading Scenarios
Bullish Scenario (Probability 35%)
Trigger: A 4-hour close above $4,179 with RSI crossing above 40 and price reclaiming the H4 MA20. Ideally, this would coincide with a softer-than-expected Core PCE or a dovish shift in Powell’s testimony.
Entry Zone: $4,180–$4,185 on a retest of the broken level.
Targets: First target $4,235 (4-hour downside target flip), second $4,315 (S1/S2 confluence), stretch target $4,357. Our gold price forecast next week suggests this scenario needs a convincing catalyst.
Stop Loss: Below $4,143 to protect against a false breakout.
Bearish Scenario (Probability 50%)
Trigger: A decisive breakdown below the 1-hour downside target of $4,143, especially on hawkish data or dollar strength. RSI dropping below 30 would confirm momentum.
Entry Zone: Sell on a retest of $4,143–$4,145 after the break.
Targets: First target $4,100, then the weekly low at $4,098. A break there exposes $4,050 and eventually the psychological $4,000 handle. This bearish case underpins our gold price forecast next week.
Stop Loss: Above $4,179.
To execute this scenario in a riba-free way, you can use SmartGoldTrade’s halal gold trading platform where you own physical gold outright.
Neutral / Range-Bound Scenario (Probability 15%)
If gold holds between $4,143 support and $4,179 resistance without a clear breakout, ranging will dominate. Traders may fade extremes: buy near $4,145 with a stop below $4,100 and target $4,175, or sell near $4,175 with a stop above $4,200 and target $4,150.
This scenario favors patience and smaller positions, as momentum signals are muted.
Traders who need concrete entry and exit points may benefit from professional gold trading signals that offer real-time trade alerts.
Regardless of the weekly noise, holding physical gold coins and bars remains a reliable long-term Islamic wealth preservation strategy.
FAQ
What is the gold price forecast next week?
Our gold price forecast next week points to a bearish bias below $4,200, with key support at $4,143 and $4,098. A break above $4,179 would flip the outlook bullish, especially if Core PCE softens.
How reliable are weekly gold price forecasts?
Weekly forecasts carry uncertainty due to unpredictable economic data and geopolitical events. They provide a probabilistic roadmap based on technicals and scheduled news, not guaranteed outcomes.
Can I trade gold based on this forecast using a halal platform?
Yes, SmartGoldTrade offers a fully halal gold trading experience with spot ownership and zero interest. You can act on our gold price forecast next week without compromising Islamic principles.