Gold price opens the Asian session at $4,188.94 on June 22, 2026, with bears immediately pressing the $4,235 make-or-break support. Liquidity is razor-thin and every tick matters. Last week, gold clung to its yearly support near the $4,100 handle, triggering a heated debate about whether a major cyclical low is forming. The June 18 analysis from FOREX.com highlighted that XAU/USD managed to hold that key floor, but conviction remains elusive. This morning’s Asian trade is all about positioning, not chasing. Traders must respect the low-volume environment and wait for clean levels before committing capital.
Gold Market Overview
Macro Context
The macro backdrop continues to punish gold bulls, keeping the gold price under heavy selling pressure. The US Dollar Index (DXY) remains elevated above 106.5, supported by last week’s hawkish Fed minutes and the first rate call from new Fed Chair Kevin Warsh. Markets are pricing in a prolonged pause, with the next rate cut not fully discounted until Q1 2027. US 10-year Treasury yields hover near 5.15%, reinforcing the opportunity cost of holding zero-yield bullion. Meanwhile, the US-Iran diplomatic breakthrough two weeks ago has drained the geopolitical risk premium that had supported gold through April and May.
Despite those headwinds, physical demand from central banks and a tentative floor in ETF outflows have prevented a disorderly collapse. The yearly support held — for now. But the macro momentum still points to a strong dollar and tight monetary conditions, keeping any gold rallies fragile and short-lived.
Session Outlook
The Asian session is notoriously illiquid, and today there is no top-tier economic data from China or Japan. The gold price will likely trade in a $4,190–$4,230 corridor based on the ATR(14) read of $30.36. Thin order books can produce sharp, fake-out moves that trap overeager traders. The safest approach is to identify the session’s range and wait for a test of the extremes before entering. Any break of the 4-hour make-or-break level at $4,235 on a closing basis would shift the structure, but a false breakout in low volume is a real risk.
Gold Price Technical Analysis
Moving Average Structure
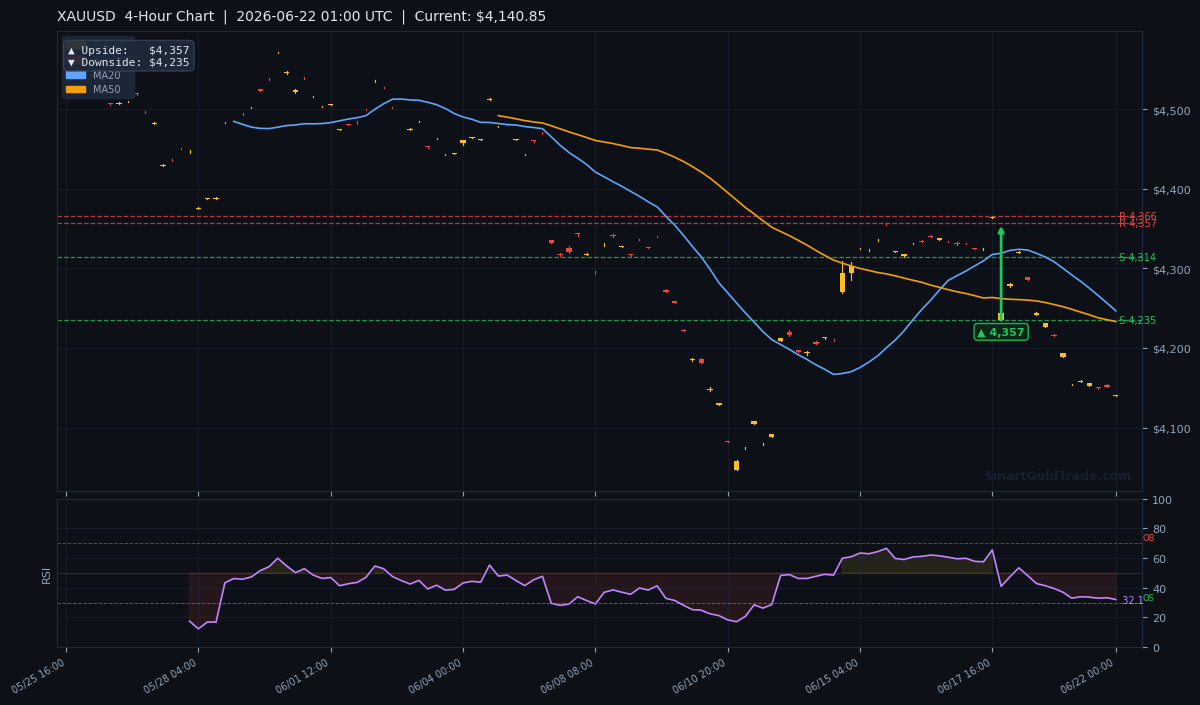
The 4-hour chart paints a conflicted picture. The gold price is $4,188.94, but the chart’s current reading sits at $4,140.85 — a spread that underscores the volatility of the Asian open. The MA20 (short) is $4,246.67 and the MA50 (medium) is $4,233.17. Price is firmly below both, signaling bearish momentum on shorter and medium-term scales. The MA200 (long) at $4,463.40 confirms the gold remains in a broader bear trend. However, the EMA structure shows MA20 > MA50, a short-term bullish cross that has not yet been validated by price. This divergence is a classic bear trap setup: if buyers cannot lift XAU/USD back above the MAs, the cross quickly fails, and the bearish trend resumes.
RSI and Momentum
The gold price’s 14-period RSI reads 32.1, sitting in the neutral-to-oversold boundary. It has not yet reached the traditional oversold threshold of 30, suggesting there is still room for further downside before a mean-reversion bounce becomes statistically attractive. Momentum on the daily chart is negative, and the H4 RSI has been unable to cross back above 40 since mid-week. Until the RSI can print above 40 and hold, any bounce is likely to be a selling opportunity rather than a trend change.
Key Price Levels
Support and resistance levels derived from the H4 pivot structure are as follows:
- Support S1: $4,315.62
- Support S2: $4,313.77
- Resistance R1: $4,365.61
- Resistance R2: $4,356.90
Note that these supports sit well above the current gold price, meaning gold is trading in what was previously a support void. This zone between $4,235 and $4,315 is now a heavy supply area that sellers will defend. The ATR(14) of $30.36 translates into a probable daily range of about $30, which puts a credible session low near $4,110 and a high around $4,230.
Below is a summary of the price targets drawn from pivot arrows on the daily, 4-hour, and 1-hour charts:
| Timeframe | Upside Target | Downside Target |
|---|---|---|
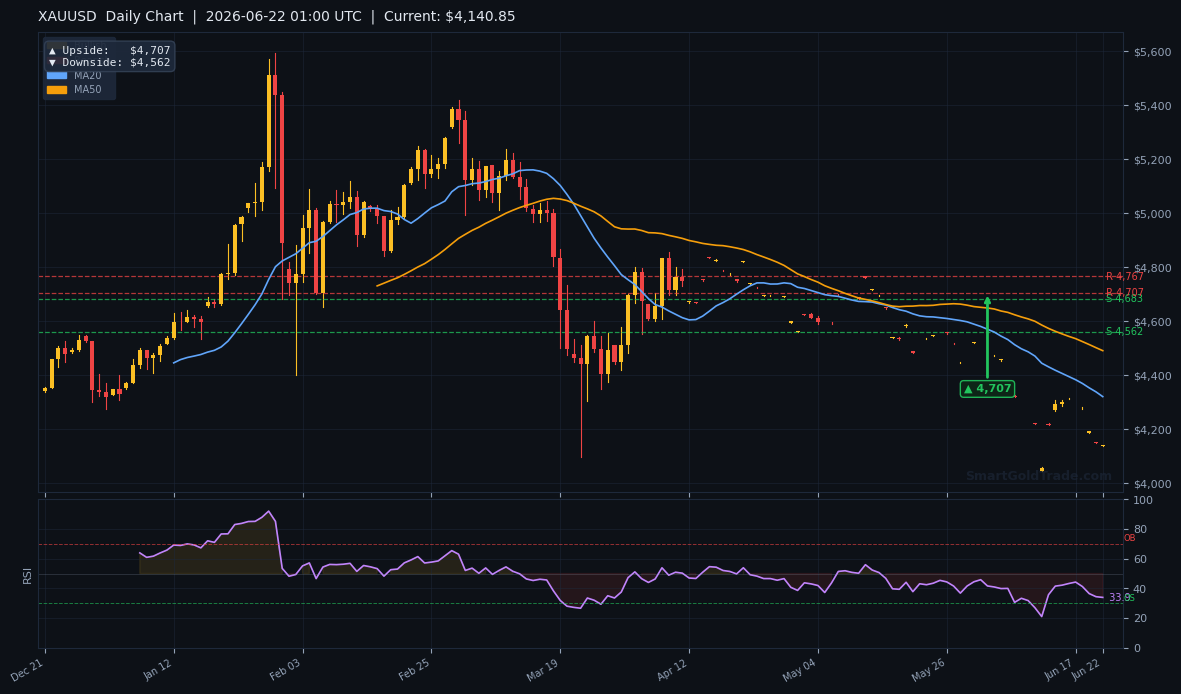
| Daily | $4,707 | $4,562 |
| 4-Hour | $4,357 | $4,235 |
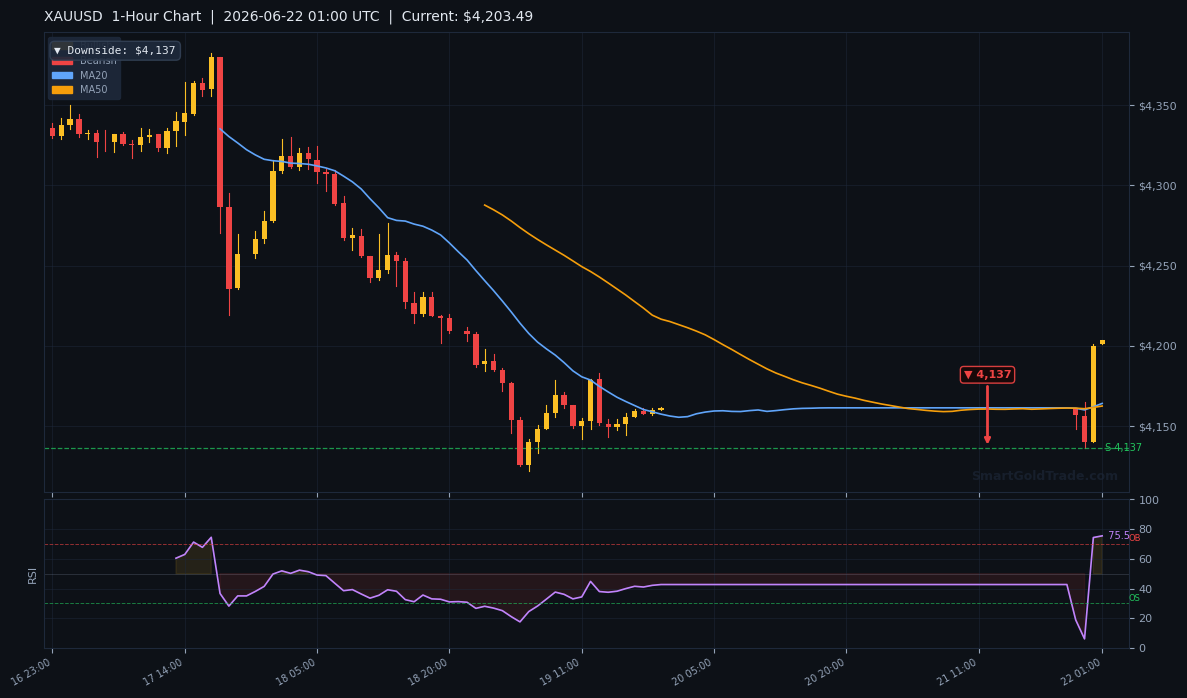
| 1-Hour | N/A | $4,137 |
Fundamental Drivers
The primary fundamental thread is the market’s repricing of Fed policy after Chair Warsh’s debut. His unexpectedly blunt tightening bias has kept the dollar bid and the gold price on the back foot. Last week’s FOREX.com note observed that XAU/USD clung to its yearly support near $4,100, raising the possibility of a major low. While that level held, the failure to generate a meaningful bounce suggests the bottoming process is incomplete.
Geopolitics remains a diminished factor. The US-Iran détente has removed a key pillar of safe-haven demand, and no new flashpoint has emerged to replace it. On the data front, US retail sales for May printed above expectations on Friday, reinforcing the narrative that the economy can handle higher rates for longer. That data point added to gold’s late-week slide.
Key Event to Watch
The most significant event on the horizon this week is the final revision of Q1 US GDP, scheduled for Thursday, June 25. If the figure is revised higher — surpassing the 1.6% initial estimate — it will further cement the “higher for longer” Fed stance and likely send the gold price toward the $4,100 yearly support. A downward surprise, however, could spark a short-covering rally back toward the $4,315 resistance. Traders should position carefully ahead of that release, as the thin post-holiday liquidity will amplify any reaction.
Devil’s Advocate
A close above $4,235 on the 4-hour chart would immediately challenge the bearish gold price thesis. If buyers can reclaim that level and then push through the $4,315.62 S1 support-turned-resistance, the short-term trend would flip neutral-to-bullish. In that scenario, a rally toward the $4,357 4-hour upside target becomes plausible. The trigger for such a gold price reversal would likely be a geopolitical shock or a sudden dovish headline. Without it, the path of least resistance remains lower.
Trading Strategy for the Asian Session
Low liquidity demands discipline. The preferred play is to wait for a minor relief bounce into the $4,235–$4,250 supply zone and then initiate a short position. This area aligns with the failed 4-hour make-or-break level and the descending MA20. A sell limit in that zone with a stop loss placed above $4,315 (the S1 pivot) or using a 1.5x ATR buffer of $45.50 above the entry will protect against a liquidity-driven spike. The initial profit target is the 1-hour downside objective at $4,137. A more ambitious swing target sits at the $4,100 psychological handle, with a final extension toward the yearly support near $4,080 if momentum persists. This setup offers a risk-to-reward ratio comfortably above 1:2.
For traders who prefer expert-analyzed entry levels, professional gold trading signals can help pinpoint precise short setups during volatile opens. Avoid buying into dips until the RSI reaches oversold territory above 30 and the price decisively recovers $4,235 on