Gold price sits at $4,161.80 on Monday, June 23, 2026, during the Asian session, as thin liquidity and a strengthening US Dollar weigh on XAU/USD. Last week's stalled progress on the US-Iran peace deal and rising expectations that the Federal Reserve will keep rates higher for longer have driven the greenback to a six-week high against the euro. The US Dollar Index (DXY) pushed higher overnight, adding pressure to gold, which now trades below all major moving averages. With Asian volumes typically subdued, the immediate outlook is set for a cautious grind. Traders should prepare for potential false breaks and avoid chasing moves in this low-liquidity environment. This session, all eyes will be on whether gold can defend the $4,161.80 level or if a break lower opens the door to the next leg down.
Gold Market Overview
Macro Context
The US Dollar strengthened early Monday as concerns resurfaced around the US-Iran peace negotiations. The safe-haven bid pushed the DXY above the 102.50 mark, while the EUR/USD drifted down to 1.1460. For gold, this dollar strength is a headwind. Additionally, hawkish Federal Reserve pricing continues to anchor shorter-dated US Treasury yields above 4.8%, making non-yielding bullion less attractive. As long-term investors rotate back into cash and bonds, physical demand for gold through channels like physical gold products may cushion deeper declines, but speculative flows remain short-biased.
Session Outlook
Asian liquidity is historically thin, and today is no exception. With Tokyo out for a public holiday, the early window will likely produce a narrow range. We expect gold price to oscillate between $4,150 and $4,170 for the first few hours. Any sudden spike should be met with scepticism. The larger Asia-Pacific event risk today is light, so the market will take its cues from the DXY and any fresh headlines around the Iran deal or the Federal Reserve. In this environment, patience beats aggression. Setting limit orders and waiting for the London crossover at 08:00 UTC remains the smart play.
Gold Price Technical Analysis
Moving Average Structure
The MA20 stands at $4,202.91, the MA50 at $4,236.83, and the MA200 at $4,447.53. With the current price at $4,161.80, gold trades below all three — a clear bearish alignment. The short-term structure is even more fragile because the MA20 has crossed below the MA50. This death cross on the H4 timeframe signals sustained downward pressure. Unless bulls recapture the $4,202 level and close above the MA20, any rally will likely be sold into.
RSI and Momentum
The 14-period RSI reads 44.1, which places it in neutral territory but tilted toward bearish. It has not reached the oversold threshold of 30, so there is still room for further decline before a mean-reversion bounce becomes statistically attractive. This suggests that momentum is not yet exhausted on the downside, and short positions may continue to find follow-through. Traders watching for a possible reversal need to see the RSI push above 50 first.
Key Price Levels
Support levels are unusual today because S1 at $4,313.77 and S2 at $4,234.79 both sit above the current price of $4,161.80. In practice, these levels now act as resistance barriers if the market attempts a rebound. On the resistance side, R1 is $4,365.61 and R2 is $4,356.90, defining a broader ceiling overhead. The ATR of $16.04 suggests an expected daily range of approximately $4,145 to $4,178. This band gives cue for stop placement and realistic profit expectations.
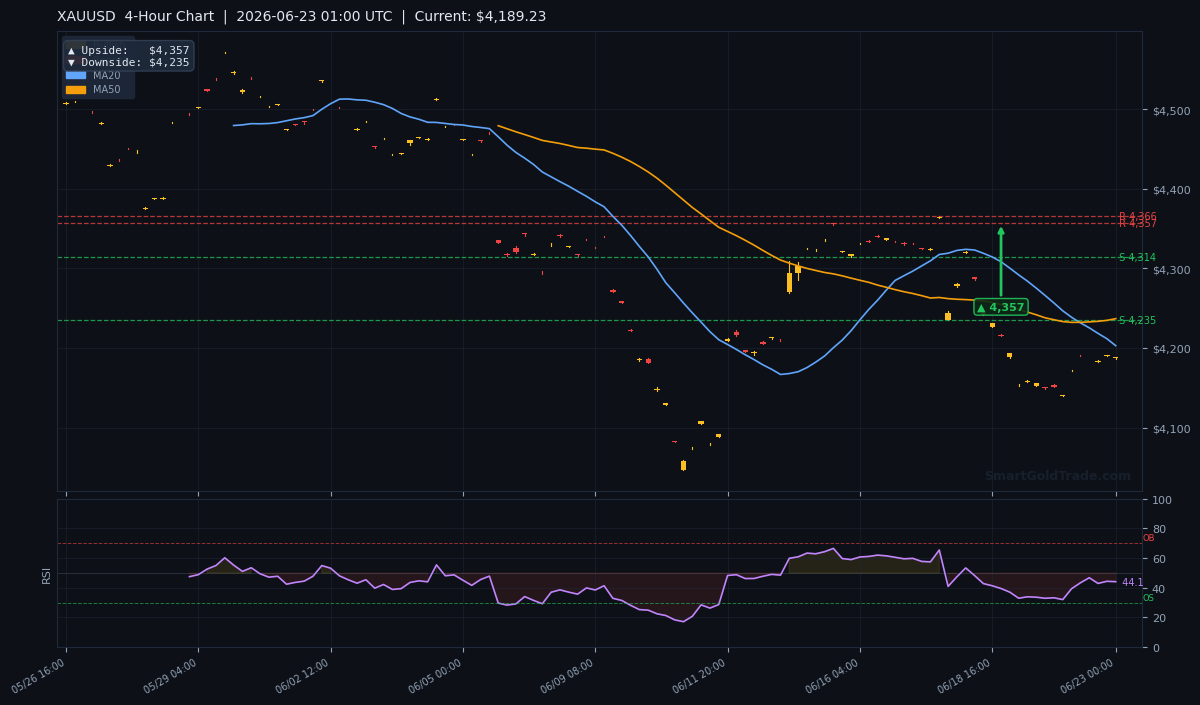
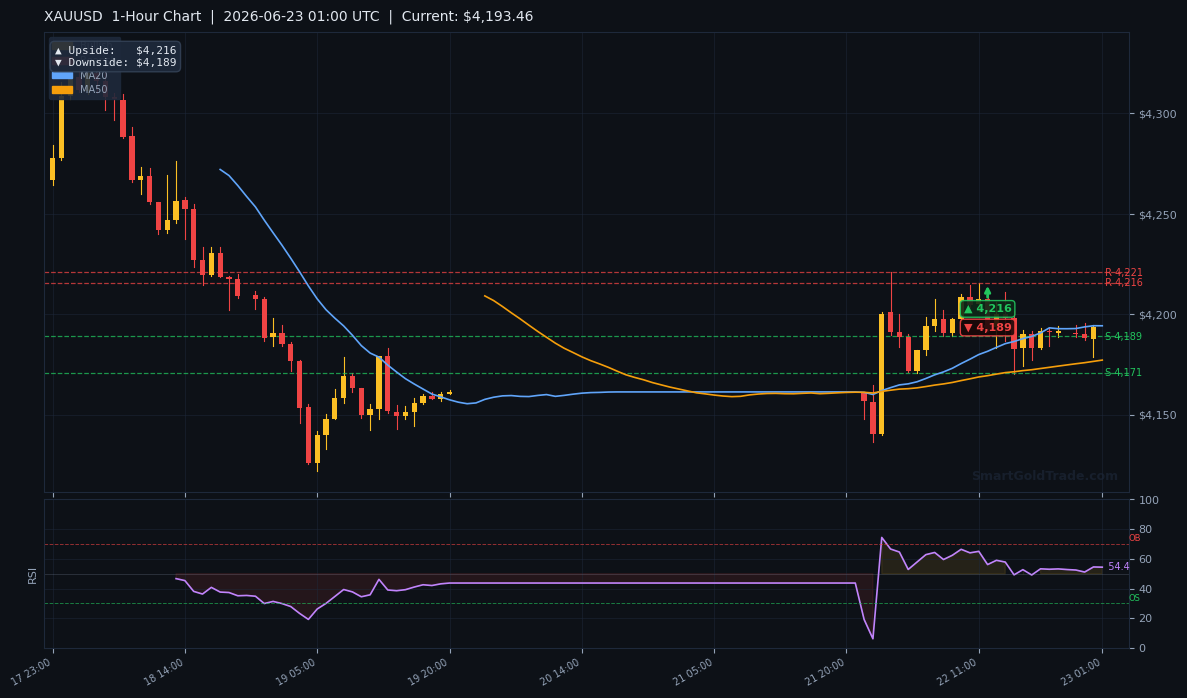
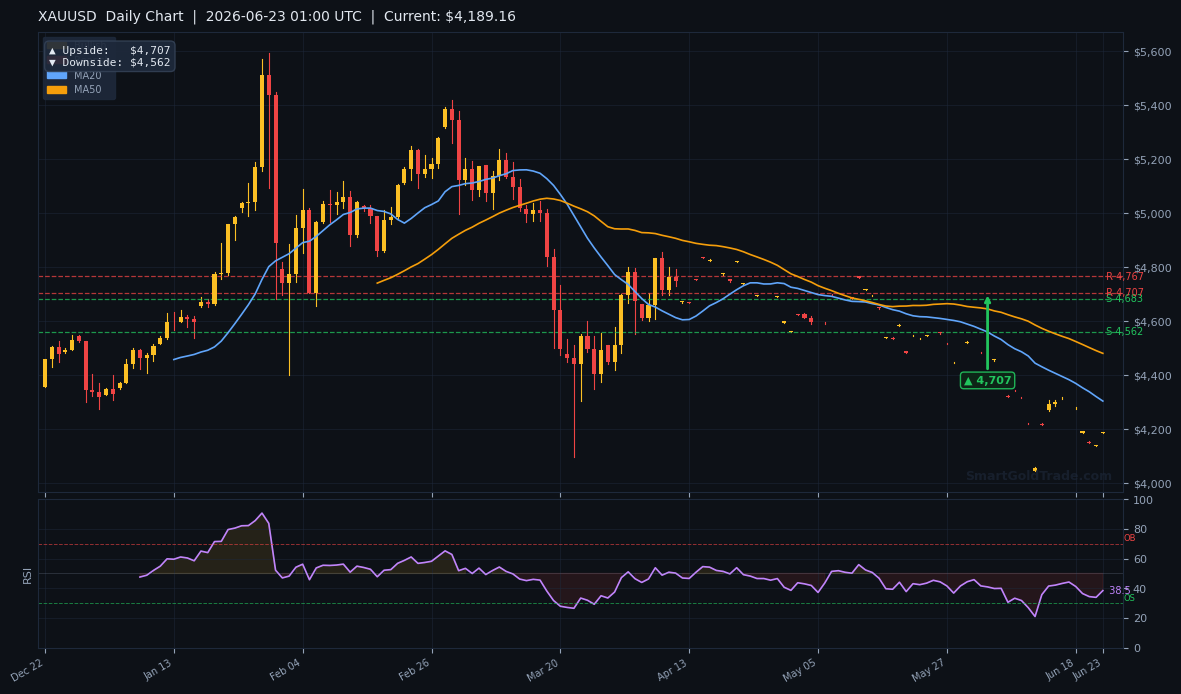
The price targets drawn on these charts add colour to the range. The 1-hour chart points to upside at $4,216 and downside at $4,189. The 4-hour chart shows a wider struggle with upside at $4,357 and downside at $4,235, while the daily chart maps an eventual swing toward $4,707 or $4,562. Below, these levels are compared:
| Timeframe | Upside Target | Downside Target |
|---|---|---|
| 1-Hour | $4,216 | $4,189 |
| 4-Hour | $4,357 | $4,235 |
| Daily | $4,707 | $4,562 |
Fundamental Drivers
Two key narratives drive gold this morning. First, the US-Iran peace deal — which initially appeared close to a framework last Thursday — hit new obstacles over the weekend, deepening geopolitical uncertainty and boosting the dollar. Gold typically benefits from geopolitical risk, but the dollar strength has overshadowed its safe-haven appeal. Second, the market is pricing in an 85% chance that the Fed holds rates steady at its July meeting, according to CME FedWatch. With no imminent rate cuts on the table, the opportunity cost of holding gold remains high. These two forces create a strong bearish undercurrent.
Key Event to Watch
This week's most important release is the US Core PCE Price Index on Friday. If the data shows stubborn inflation, the dollar could surge further, pressuring gold toward $4,150. Conversely, a softer print may trigger a relief rally back above $4,235. Trading ahead of this number will be tentative, so the Asian and London sessions could remain range-bound until Wednesday at the earliest.
Devil's Advocate
The bearish thesis rests on a strong dollar and high US rates. If the US-Iran talks suddenly yield a breakthrough and geopolitical risk collapses, the dollar could weaken, sparking a sharp short squeeze in gold. In that scenario, a move above $4,235 would invalidate the immediate bearish bias. If the price climbs back above the MA20 at $4,202 and holds, the bearish structure cracks. Under a reversal, the next upside target becomes $4,357 on the 4-hour chart. Traders must accept that this low-volume environment can produce whipsaws — a false breakout above the MA20 is entirely possible.
Gold Price Trading Strategy for Asian Session
Given the bearish alignment, short entries on minor rallies offer the best risk-reward. With gold price now at $4,161.80, any pullback toward the MA20 near $4,202–$4,216 presents a high-probability selling opportunity. Place a stop loss at $4,235 — above the S2 level and the MA50 — using the ATR value of $16.04 as a buffer. The first profit target is $4,150, a round psychological level, with a more aggressive secondary target at $4,145, near the lower ATR band. For those unable to monitor the screen, professional gold trading signals can help time these entries with precision. For traders who follow Islamic finance principles, a halal gold trading platform ensures every position remains riba-free and backed by physical ownership. Never chase a breakdown — low liquidity can invite sudden reversals. If gold holds above $4,202 for more than two hours, exit short positions and reassess.
Key Takeaways
- Gold price is $4,161.80, below all three major moving averages, signalling a bearish short-term trend.
- Thin Asian liquidity warns against chasing sharp moves; $4,150–$4,170 is the likely initial range.
- The US-Iran peace deal impasse and hawkish Fed expectations keep the dollar bid, capping gold upside.
- A break below $4,161.80 opens a path toward $4,150 and then $4,145, while a recovery above $4,202 invalidates the bearish call.
- The RSI at 44.1 leaves room for further downside before any oversold bounce materialises.
- Friday's Core PCE reading is the week's main event; expect volatility to contract until then.
Conclusion
Gold price starts the week under pressure near $4,161.80, with a strong US Dollar and low Asian liquidity keeping the bias firmly negative. The technical structure — price below the MA20 and MA50, RSI in the lower neutral zone — points to further downside probing. A break of $4,161.80 would likely accelerate selling toward the ATR-implied $4,145 target. However, any positive news on the US-Iran front or a softer PCE print later this week could quickly flip the narrative. Until then, the prudent approach is to sell rallies and respect the range.
FAQ
Why is gold falling despite geopolitical uncertainty? Geopolitical risk usually lifts gold, but the simultaneous surge in the US Dollar overwhelms that effect. With the DXY above 102.50 and US rates elevated, gold's non-yielding nature becomes a disadvantage, driving speculators away from long positions.
What is the most important support level today? The immediate floor is the current gold price near $4,161.80. A sustained break below this level would put $4,150 and then $4,145 in play, while the next chart-based support is not visible until the $4,150 region.
What event could reverse the bearish bias? A surprise resolution in the US-Iran peace talks or a significantly weaker US Core PCE figure on Friday could sink the dollar and send gold back above $4,235. In that scenario, the $4,357 4-hour upside target becomes the next focus.
Trading Gold (XAU/USD) carries significant risk of loss and is not suitable for all investors. This content is for informational purposes only and does not constitute financial advice. Always conduct your own research and trade responsibly.