Gold price hovered at $4,312.76 as the Asian session got underway on Tuesday, June 16, slipping just below the $4,316 downside marker identified on the 4-hour chart. That level could define the near-term trend. Over the weekend, news broke that US President Trump had struck an agreement with Iran to keep the Strait of Hormuz permanently toll-free — a development that may be slowly draining the geopolitical risk premium from the market. But with Asian liquidity paper-thin, the real test is whether bids can reclaim the pivot.
This session sets the stage — traders who chase a breakout here risk being whipsawed by low-volume noise. Instead, the disciplined approach is to map the levels, wait for confirmation, and act only when the market shows its hand.
Gold Price Market Overview
Macro Context
The macroeconomic backdrop remains a tug-of-war between a resilient US dollar and lingering geopolitical uncertainty. The Dollar Index (DXY) has held firm above 104.00, reflecting confidence that the Federal Reserve will keep rates elevated through the summer. Meanwhile, the US 10-year Treasury yield is hovering near 4.35%, offering an attractive alternative to zero-yield gold. However, Sunday’s Iran deal announcement — while seemingly de-escalatory — introduces a new variable. If the Strait of Hormuz truly becomes toll-free, shipping costs and oil prices could dip, pulling inflation expectations lower and undercutting gold price support as an inflation hedge. Still, no paperwork has been signed, and markets have learned to treat diplomatic breakthroughs with caution.
Fed funds futures are pricing in less than a 20% chance of a rate cut at the next meeting, keeping the opportunity cost of holding gold elevated. For now, the macro wind is blowing across the bow, but not yet breaking the mast.
Session Outlook
The Asian session is notorious for thin order books and jagged price action. Today’s calendar is bare, leaving gold price vulnerable to headline-driven spikes rather than data-driven trends. The 4-hour ATR of $20.75 suggests the metal could traverse a broad range between roughly $4,297 and $4,338 over the full day, but the Asian hours typically carve out a narrower corridor.
Traders should expect a tentative drift around the $4,316 pivot, with any sudden move above $4,345 or below $4,306 triggering short-term momentum. Liquidity providers in Tokyo, Singapore and Sydney will likely keep spreads tight until Europe steps in, but a false breakout is a real danger. Patience is not a virtue here — it is a requirement.
Technical Analysis
Moving Average Structure
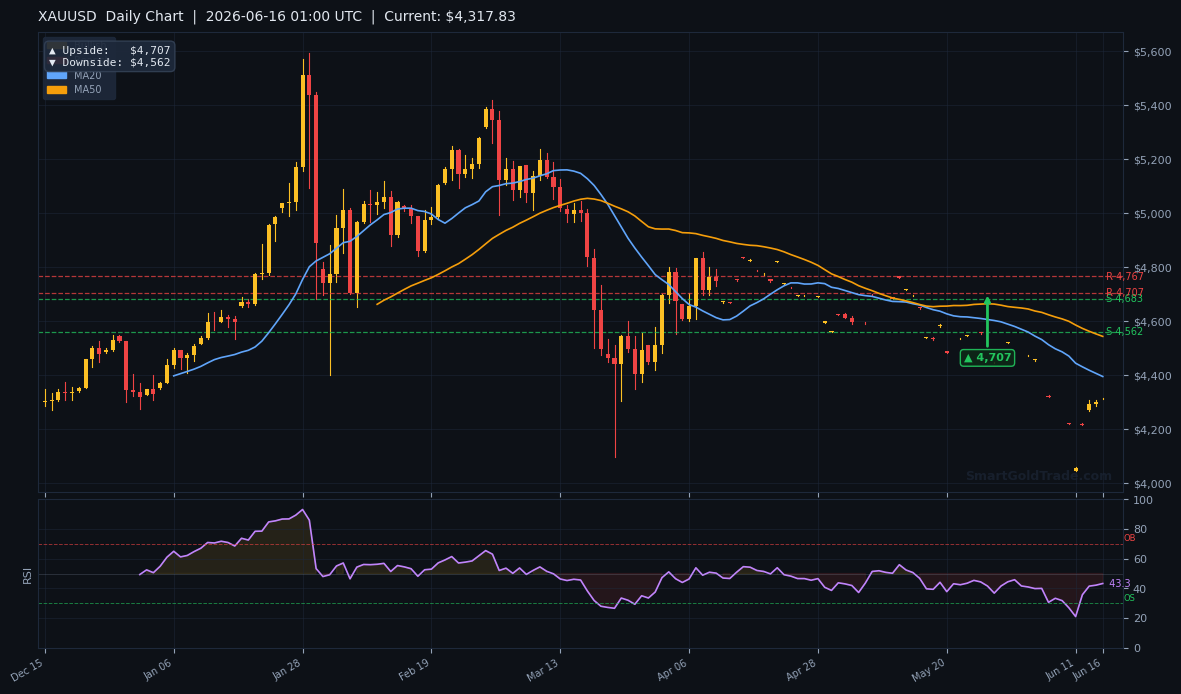
Gold’s moving average arrangement tells a conflicted story. The 20-period simple moving average sits at $4,221.70, and the 50-period at $4,287.74. Price is comfortably above both, which on the surface looks bullish. However, the critical detail is the relationship between the two: MA20 is below MA50. This configuration — known as short-term bearish pressure — implies that despite the recent bounce, the underlying trend lacks conviction. The 200-period moving average at $4,503.28 looms far overhead, confirming that the broader structure remains bearish. Unless gold can reclaim that long-term average, rallies should be viewed with suspicion.
RSI and Momentum
The 14-period Relative Strength Index reads 59.0, comfortably in neutral territory. It is neither overbought nor oversold, which means the gold price has room to move in either direction without immediate exhaustion. This neutrality reinforces the need to wait for price confirmation rather than attempt a top-pick or bottom-fish. A push above 70 on the RSI would signal strengthening bullish momentum; a drop below 50 would confirm bearish intent. For now, momentum is a glass half empty.
Key Price Levels
The chart offers two support clusters. S1 at $4,442.32 and S2 at $4,441.83 are nearly overlapping — a dense zone that will act as a formidable ceiling if approached from below. On the resistance side, R2 appears at $4,470.85 and R1 at $4,513.84. The inversion (R2 below R1) underscores the choppy, corrective nature of the price action.
The daily and intraday pivot arrows refine these zones: the 4-hour chart plots downside risk at $4,316 and upside potential at $4,471, while the 1-hour chart narrows the range to $4,306 on the downside and $4,345 on the upside. This creates a clear battlefield: $4,316 as the make-or-break floor, and $4,345 as the immediate ceiling.
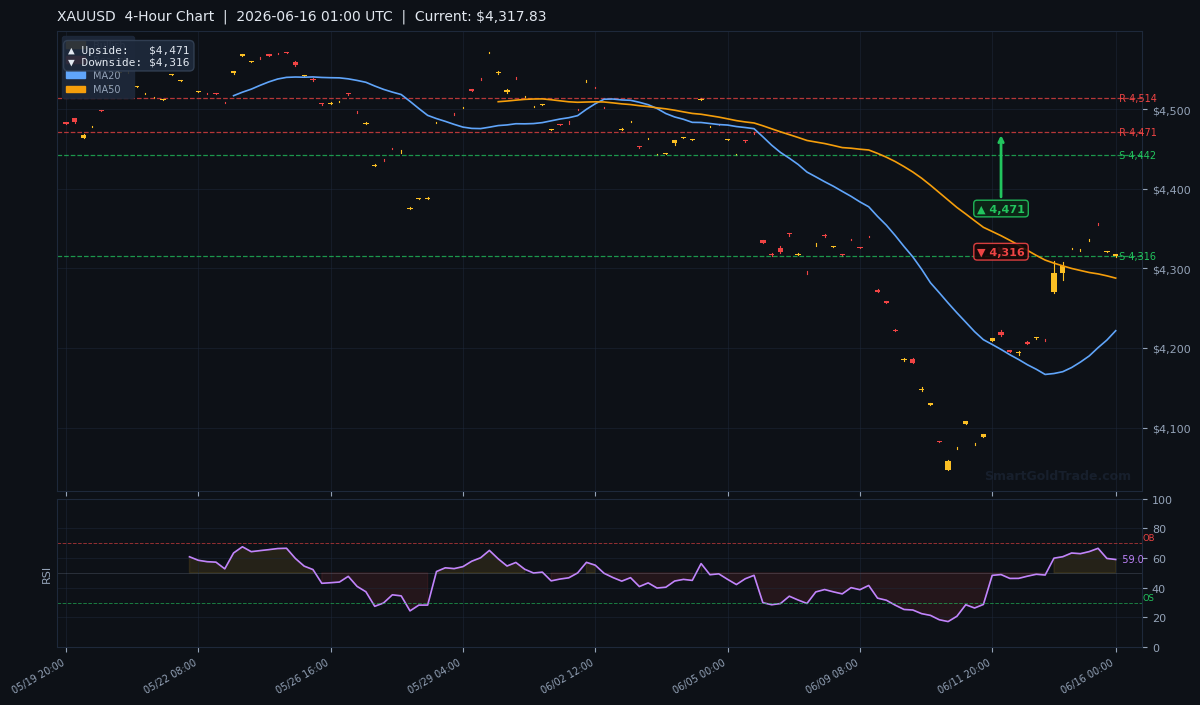
The 4-hour chart above captures the broader bearish structure, with price clinging to the lower boundary of a corrective channel. Note the cluster of pivots near $4,316 — a level that has acted as both support and resistance in recent weeks.
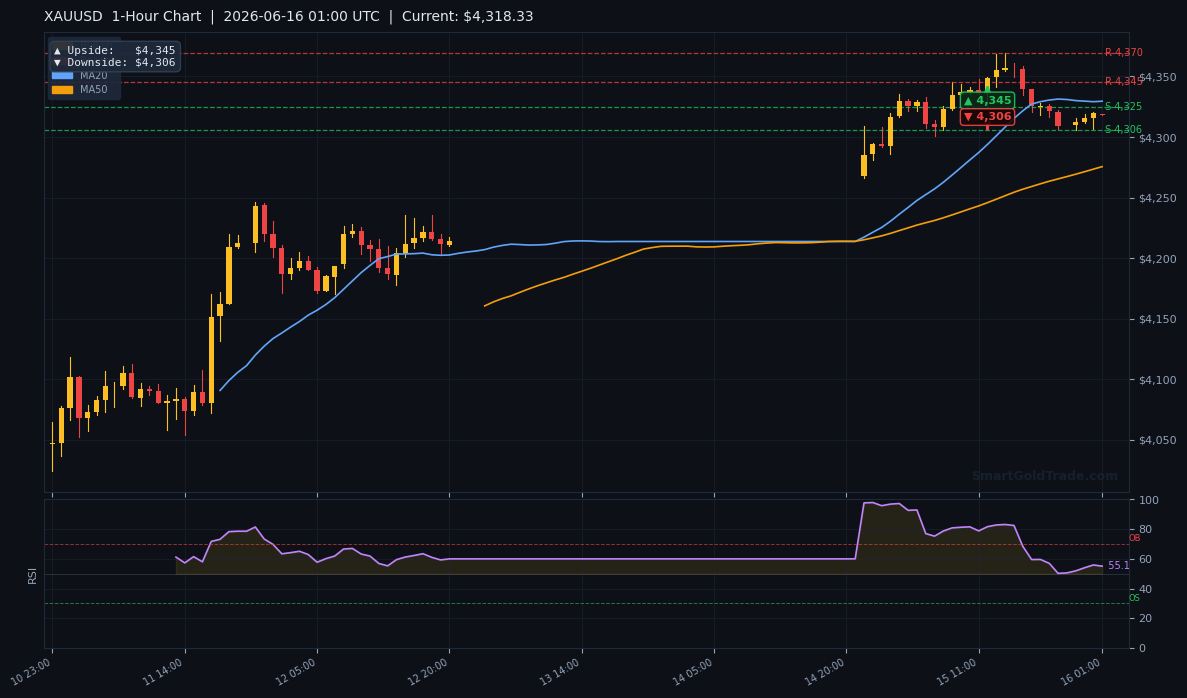
The 1-hour chart zooms in on the overnight drift. A descending trendline from the weekend’s post-news spike aligns with the $4,345 resistance. A break above that line would be the first signal that bulls are gaining traction.
Fundamental Drivers
The primary news weighing on gold price this session is the weekend agreement between the United States and Iran. President Trump, in a statement echoed by the New York Times, declared the deal would ensure the Strait of Hormuz remains ‘permanently toll free.’ While specifics are scarce, the mere prospect of reduced friction in the Persian Gulf strips away some of the fear premium that has supported gold prices for months. If oil prices slide in response, gold could feel the follow-through, as lower energy costs dampen inflation expectations.
Offsetting this, however, is the skepticism that has greeted past Iran deals. True implementation remains uncertain, and any hiccup could reignite safe-haven buying. Domestically, the Fed’s steady hand — reinforced by a string of hawkish speeches last week — keeps the dollar supported. The DXY’s firm footing above 104 suggests gold price will struggle to mount a sustainable rally without a fresh catalyst.
Key Event to Watch
Wednesday’s US retail sales report stands out as the week’s most consequential data release. A strong print would reinforce the ‘higher for longer’ rate narrative, piling pressure on gold price. A miss, conversely, could revive rate-cut hopes and lift bullion. For today, however, the Asian session lacks scheduled events, leaving headlines and flow-driven swings as the primary movers.
Devil's Advocate
Every thesis has its flaw, and the bearish tilt here is no exception. A clean break above $4,345 — the 1-hour upside pivot — would invalidate the immediate downside bias and point to a retest of the $4,470–$4,513 resistance zone. Moreover, if the moving averages reverse course and see the MA20 cross back above the MA50, the short-term bearish pressure would dissipate, shifting the picture to a recovery rally.
The Iran deal could also prove to be paper-thin; any Iranian backtracking or congressional pushback in Washington would resurrect the risk bid and send gold sharply higher. For bears, the line in the sand is $4,345. Above it, the trade is no longer viable.
Trading Strategy for Asian Session
The low-volume Asian session demands a conservative, level-based approach. Aggressive entries invite slippage. The two high-probability setups for today are as follows:
Bearish Bias: With gold price at $4,312.76 already below the $4,316 pivot, a sustained hourly close beneath that level would confirm the breakdown and open the door to $4,306 (1-hour downside) and possibly $4,290 (ATR-based extension). Enter on a retest of the broken support as resistance, with a stop placed above $4,345. This gives a risk of roughly $30 — manageable within the $20.75 ATR when allowing for session volatility. First take-profit at $4,306, second at $4,290.
Bullish Bias: If gold price refuse to break lower and start printing higher lows on the 15-minute chart, a bounce trade into $4,345 becomes compelling. Entry near $4,316 with a stop below $4,306 (risking $10) offers an asymmetrical opportunity. Target $4,345 first, then $4,471 if momentum accelerates into the European open. Because the broader trend is bearish, bullish positions should be treated as counter-trend scalps, taken with smaller size and tighter stops.
Regardless of direction, traders should avoid entering during the first 30 minutes of the session, allowing the initial noise to settle. For those seeking to remove emotion, automated systems like Expert Advisor for gold can execute these levels with precision, 24/7. Meanwhile, SmartGoldTrade’s interest-free spot gold trading platform ensures you are trading the metal itself — not a derivative subject to swap fees. If you prefer to hold the tangible asset, you can purchase physical gold coins and bars directly as a long-term hedge.
Key Takeaways
- Gold price at $4,312.76 slips below the $4,316 4-hour downside pivot, tilting the immediate bias to the downside.
- MA20 below MA50 signals persistent short-term bearish pressure despite price holding above both averages.
- RSI at 59 leaves room for a move in either direction — no imminent exhaustion.
- ATR of $20.75 projects a potential daily range of $4,297 to $4,338.
- The Iran deal over the weekend has drained some geopolitical risk premium, but traders remain skeptical.
- A break below $4,316 targets $4,306 and $4,290; a bounce above $4,345 opens $4,471.
- Low Asian liquidity demands patience — false breaks are the rule, not the exception.
Conclusion
Gold price kicks off Tuesday’s Asian session at $4,312.76, just beneath the critical $4,316 pivot. This puts bears in control early, with $4,306 as the immediate target. Bulls need a quick reclaim of the pivot to mount a relief rally toward $4,345; failure to do so keeps the pressure firmly on the downside. The weekend’s Iran agreement has softened the safe-haven bid, but thin overnight trading means any move must be treated with skepticism. Until London opens, the smart capital sits on its hands. Levels are drawn, risk is defined, and the market will reveal its hand soon enough. Patience now pays later.
FAQ
- What is the current gold price as of June 16, 2026?
- The live gold spot price is $4,312.76 per troy ounce at the start of the Asian session.
- Where is the nearest support for gold price today?
- The most immediate support is the 4-hour downside pivot at $4,316. Below that, the 1-hour chart identifies $4,306 as the next cushion.
- What factors are moving the gold price right now?
- The weekend’s US-Iran deal to keep the Strait of Hormuz toll-free has reduced some geopolitical fear premium, while a strong dollar and hawkish Fed expectations continue to cap upside. Thin Asian liquidity also amplifies short-term swings.
- Is gold in a bearish or bullish trend right now?
- The trend is conflicted. Short-term indicators show bearish pressure with MA20 below MA50, but price is above both averages. The long-term trend remains bearish below the $4,503.28 MA200.