
The gold price is trading at $4,544.99 as the American session begins on May 17, 2026 — a level that screams oversold after a relentless sell-off. Last week’s neutral stance from the Fed, combined with a steady dollar, pushed XAU/USD below key moving averages, but the RSI has now dropped to extreme lows not seen since the March correction. For active traders, this creates a clear opportunity: a short-term bounce trade with defined risk. Let’s break down the levels that matter right now.
Gold Market Overview
Macro Context
The U.S. Dollar Index (DXY) is holding near 104.80, supported by last week’s retail sales beat and the Fed’s neutral tone. Treasury yields remain elevated, with the 10-year at 4.32%, capping non‑yielding assets like gold. Geopolitical tensions between Iran and the U.S. have eased slightly, reducing safe‑haven demand. However, the macro backdrop still favours a cautious dollar bid, which has been the primary drag on the gold price.
Session Outlook
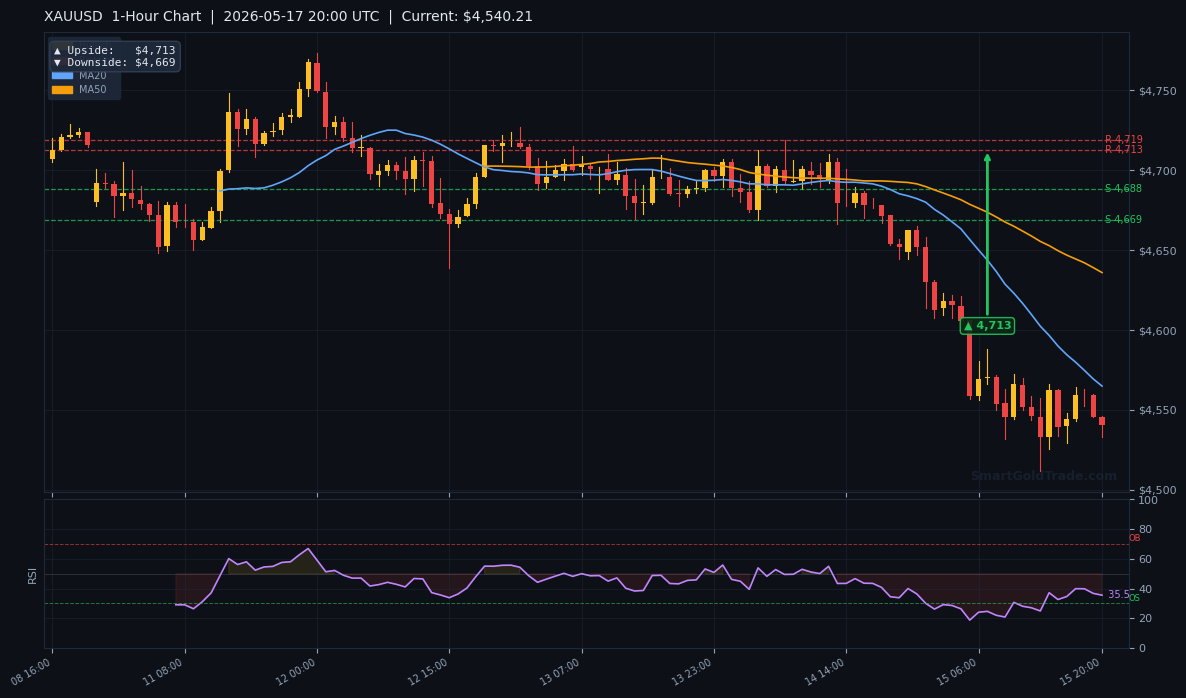
In the American session, liquidity will be driven by NY open and potential stop‑runs below the recent lows. With RSI at 27.8, any news miss could spark a sharp reversal. The expected daily range based on ATR is roughly $18.32, meaning a move toward $4,713 is well within reach if support holds. Watch the 4,667 area as the line in the sand for bears.
Technical Analysis
Moving Average Structure
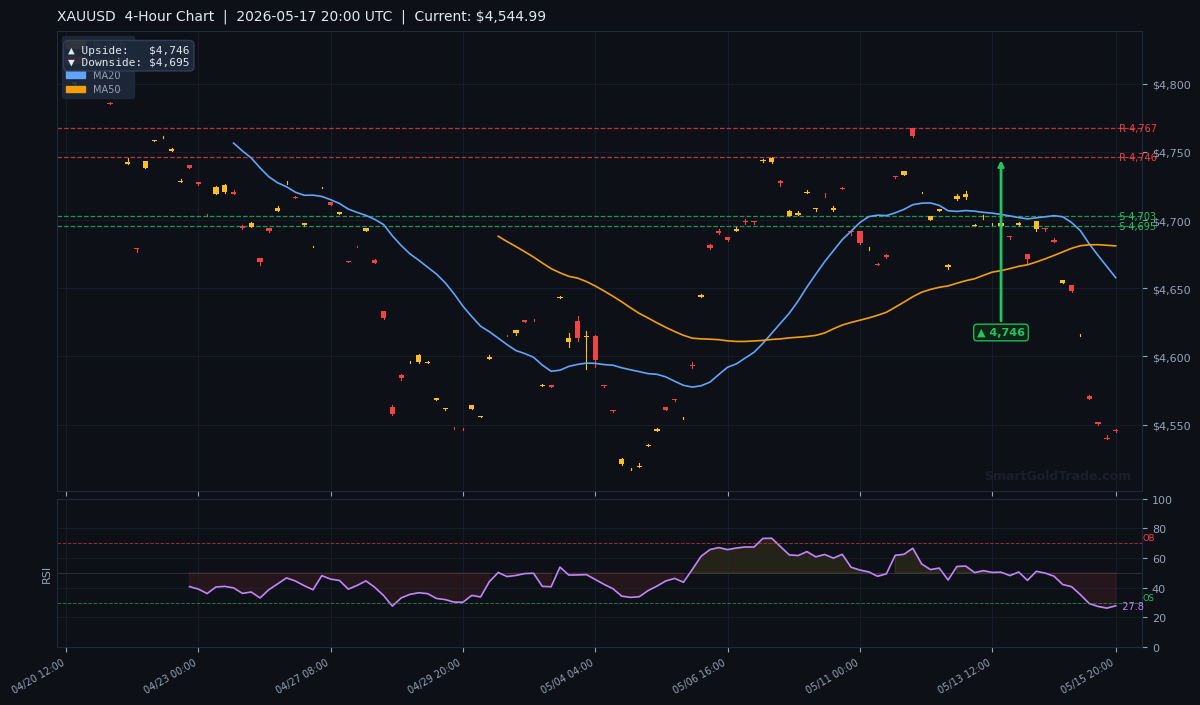
The moving averages paint a clear bearish picture. The 20‑period MA on H4 sits at $4,657.76, the 50‑period MA at $4,681.07, and the 200‑period MA at $4,698.96. Price is decisively below all three, confirming a short‑term bear trend. The MA20 < MA50 crossover adds to the downside pressure. A recovery above the MA20 would be the first sign of a trend change.
RSI and Momentum
The 14‑period RSI on H4 is 27.8 — solidly in oversold territory. This is the most extreme reading in over a month. While oversold does not guarantee a bounce, it does warn that selling momentum is exhausted and a snap‑back rally is statistically likely. Divergence is not yet visible, but price action over the next few candles will be critical.
Key Price Levels
From the live chart data, the immediate support levels are S1 at $4,702.94 and S2 at $4,695.39. On the upside, R1 at $4,767.25 and R2 at $4,745.97 represent the first test zones. The ATR(14) of $18.32 suggests a move from the current price to the 1‑hour upside target of $4,713 is a 0.7‑sigma move — very achievable.
Fundamental Drivers
Key Event to Watch
This week, the most important event is Wednesday’s FOMC minutes release. Traders will scrutinise the tone for any shift from the neutral stance signalled at the last meeting. If the minutes reveal a dovish lean, the dollar could weaken and gold price could pop. Conversely, a hawkish surprise would confirm further downside. Until then, the market is likely to be driven by technicals and intraday flows.
Devil’s Advocate
The oversold bounce thesis fails if the gold price breaks below the 4‑hour support at $4,695.39 with conviction. Such a close would target the next support at $4,667, and a break there could accelerate selling toward the 200‑day moving average near $4,600. A strong dollar rally or a surprise hawkish Fed speak would be the catalyst. In this scenario, all long trades should be closed immediately.
Trading Strategy for American Session
Trade Bias: Bullish bounce toward resistance.
Entry Zone: Look to buy on a retest of the $4,540 – $4,545 area, which aligns with the current price and is below the 1‑hour chart target downside arrow at $4,669. This gives a tight stop.
Stop Loss: Place a stop at $4,667 — below the 1‑hour pivot downside target and a logical support level. This is approximately 1.5 x ATR risk per lot.
Take Profit 1: $4,713 (1‑hour upside target).
Take Profit 2: $4,746 (4‑hour upside target).
Use a risk‑reward ratio of at least 1:2. For those preferring a passive approach, consider copy trading from top performers who are already positioned for this bounce.
Key Takeaways
- Gold price at $4,544.99 is deeply oversold with RSI 27.8.
- Price is below all major moving averages — MA20 at $4,657.76, MA50 at $4,681.07, MA200 at $4,698.96.
- Resistance at $4,713 (H1 pivot) and $4,746 (H4 pivot).
- Key support at $4,695.39 (S2) and $4,667 (daily downside target).
- ATR of $18.32 indicates a bounce to $4,713 is within a single move.
- FOMC minutes on Wednesday are the main fundamental catalyst this week.
Conclusion
The gold price has entered a textbook oversold zone. While the bear trend remains intact above the moving averages, the extreme RSI reading and proximity to a well‑defined support cluster make a bounce trade compelling. The strategy outlined above offers a clear entry, a tight stop, and two profit targets that align with the chart’s own pivot arrows. Manage risk, stay patient, and let the market confirm the move.
Frequently Asked Questions
- Is $4,544 a good entry for gold today?
- Yes, because the RSI is oversold at 27.8 and price is near a support zone that has held historically. The risk to reward is favourable with a stop at $4,667 and a first target at $4,713.
- What happens if gold breaks below $4,667?
- A close below $4,667 would invalidate the bounce trade and open the door to $4,600 or lower. In that case, avoid long positions until a new support forms.
- When is the best time to trade gold during the American session?
- Between 14:00 and 17:00 UTC when U.S. economic data (like retail sales, jobless claims) is released. Today, watch for any Fed headlines that could spike volatility.
- Can I trade this setup without leverage?
- Absolutely. Many platforms offer spot gold trading without leverage. For a Shariah‑compliant, riba‑free alternative, check out halal gold trading where you own physical gold in gram lots with no interest.
Risk Disclaimer: Trading Gold (XAU/USD) carries significant risk of loss and is not suitable for all investors. This content is for informational purposes only and does not constitute financial advice. Always conduct your own research and trade responsibly.