
The gold price is trading at $4,213.53 as the American session gets underway, consolidating after a push higher. The market is digesting last week's US inflation data and positioning for potential volatility from this week's retail sales figures. With the metal stuck between a supportive short-term moving average structure and the formidable barrier of the 200-day MA, the immediate direction hinges on New York's liquidity and risk appetite.
Gold Price Market Overview
Macro Context
The US Dollar Index (DXY) remains a key counterweight to the gold price performance. Treasury yields, while off their recent peaks, continue to reflect expectations for the Fed's policy path. Last week's Consumer Price Index print has been absorbed, leaving traders to focus on forward guidance and global risk sentiment. Geopolitical tensions, including the upcoming Colombian presidential election on May 31, 2026, provide a steady undercurrent of safe-haven demand. This often boosts interest in physical gold products as a tangible store of value. However, the primary driver remains the real interest rate outlook and the dollar's strength.
From a Fed perspective, the narrative has shifted from the timing of cuts to their potential depth. This keeps a lid on aggressive gold price rallies but also provides a floor, as any sign of economic softening could accelerate dovish repricing. The current environment is one of equilibrium, waiting for a fresh catalyst to break the range.
Session Outlook
The American session typically brings the highest liquidity and decisive moves. With no tier-one US data scheduled for today's session, price action will be driven by technical flows, shifts in bond markets, and any unscheduled geopolitical headlines. Given the Average True Range of $24.60, we can expect a potential daily range of approximately $50. A break above $4,240 could trigger a run toward the 200-day MA, while failure to hold $4,190 may see a swift test of lower supports.
Gold Price Technical Analysis
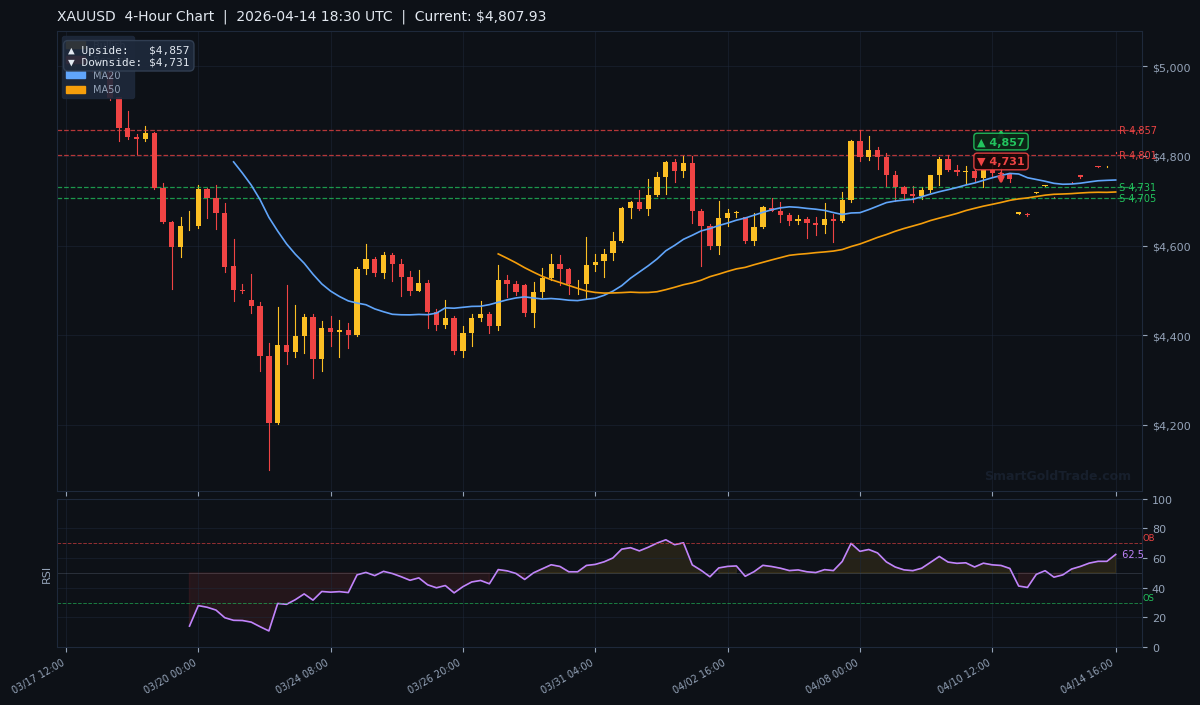
Gold is presenting a mixed technical picture on the 4-hour chart, with momentum indicators conflicting with the primary trend structure. The gold price action is currently trapped between converging forces, making the next directional move critical for the short-term bias.
Moving Average Structure
The short-term trend structure is bullish. The gold price at $4,213.53 is trading above both the MA20 at $4,152.00 and the MA50 at $4,125.00. The fact that the MA20 is above the MA50 confirms short-term bullish momentum. However, the major hurdle is the long-term MA200, currently at $4,252.00. The price's position below this key level keeps it in a broader bear territory, capping the upside for now.
RSI and Momentum
The RSI(14) reading is 62.5, which sits in the neutral range. It is not yet overbought, suggesting there is room for further upside momentum if buyers step in. However, traders should watch for bearish divergence if price makes a higher high while the RSI makes a lower high. This would signal fading momentum and often precedes a pullback.
Key Price Levels
Immediate resistance is clearly defined at R1: $4,263, which aligns closely with the 200-day MA. A break above could target R2: $4,312. On the downside, the first significant support is at S1: $4,136. A breach here would open the path toward S2: $4,111. The ATR(14) of $24.60 suggests today's expected trading range is approximately $4,188 to $4,238.
| Timeframe | Upside Target | Downside Target |
|---|---|---|
| Daily | $4,550 | $4,000 |
| 4-Hour (H4) | $4,263 | $4,136 |
| 1-Hour (H1) | $4,240 | $4,190 |
Gold Price Fundamental Drivers
Beyond the dominant Fed and dollar narrative, specific geopolitical events are on the radar. The upcoming Colombian presidential election on May 31, 2026, is being watched. As noted by Societe Generale, polls suggest a runoff where a unified right has an advantage. Political instability in resource-rich nations can sometimes trigger regional safe-haven flows into gold, though the direct impact on XAUUSD is often muted compared to major central bank policy.
The core fundamental driver remains the inverse correlation with the real yield on US Treasuries. Any surprise in this week's US Retail Sales data could shift expectations for economic strength and, by extension, Fed policy. A stronger-than-expected reading could bolster the dollar and pressure the gold price, while a weak number would do the opposite.
Key Event to Watch
This week, the most critical data point for the gold price will be US Retail Sales. As a primary gauge of consumer health, a significant deviation from forecasts can swiftly alter the interest rate outlook. A hot number could reinforce a 'higher-for-longer' Fed stance, pushing yields and the dollar up, and testing gold's support at $4,136. A miss would fuel recession concerns and potential Fed dovishness, likely propelling gold toward the $4,263 resistance.
Devil's Advocate
The prevailing short-term bullish structure is not invincible. The most compelling bearish argument is the stark rejection at the long-term MA200. This level has defended the primary bear trend for months. A failure to reclaim it now, coupled with an RSI that is losing upward momentum, could signal another leg down.
The key level that would invalidate the immediate bullish bias is a daily close below the MA20 at $4,152. This would break the short-term momentum and likely trigger a flush toward S1 at $4,136 and possibly S2 at $4,111. A scenario where US data surprises to the upside, sending the DXY sharply higher, is the most likely catalyst for such a move.
Trading Strategy for American Session
Given the conflicted signals—bullish MA structure but resistance at the 200-day MA—a cautious, level-based approach is prudent for the American session. The ideal scenario is to wait for a confirmed breakout or a pullback to stronger support.
Bullish Scenario (Breakout): Wait for a sustained 4-hour close above $4,240. This could signal a genuine attempt at the 200-day MA. A conservative entry would be on a retest of $4,240 as support. Initial target is R1 at $4,263, with a stretch target at the daily pivot of $4,312. A stop loss should be placed below the recent swing low, approximately $4,225 (using half the ATR for a tight stop).
Bearish Scenario (Rejection): If price is rejected from the $4,240–$4,250 zone and shows signs of rolling over, a short entry can be considered with a stop above $4,260. The primary target is the confluence of support at the MA20 ($4,152) and S1 ($4,136). A break below S1 opens the path to S2 at $4,111. For those seeking a halal gold trading approach, this would constitute a sell-off of a physical position, not a leveraged short. Traders who prefer to follow expert-analyzed entry points can also incorporate professional gold trading signals to validate these key levels in real time.
Key Takeaways
- The gold price at $4,213.53 is in a short-term bullish structure but faces major resistance at the 200-day MA ($4,252).
- Key support levels are $4,136 (S1) and $4,111 (S2); key resistance is $4,263 (R1).
- The neutral RSI at 62.5 suggests the move is not exhausted, but watch for bearish divergence.
- This week's US Retail Sales data is the primary fundamental catalyst that could break the current range.
- A close below the MA20 at $4,152 would invalidate the short-term bullish bias.
- The ATR suggests an expected daily range of roughly $50, centered around the current gold price.
Conclusion
Gold is at an inflection point. The battle between the bullish short-term moving averages and the bearish long-term 200-day MA will define the next directional move. While the momentum favors a test of higher resistance, the risk of a sharp rejection and pullback is significant. Traders should adopt a patient, level-driven strategy, waiting for a clear break of either $4,240 to the upside or $4,190 to the downside before committing capital. The outcome of this consolidation will set the tone for the rest of the trading week.
Frequently Asked Questions
- Is gold in a bull or bear market right now?
- It depends on the timeframe. Short-term (daily chart), it's bullish as the gold price is above the MA20 and MA50. Long-term, it's still in a bear market as the price remains below the critical 200-day Moving Average at $4,252.
- What is the most important level for gold today?
- The 200-day Moving Average at $4,252 is the most significant resistance. A decisive break above this could trigger a larger rally. On the downside, watch $4,136.
- How much volatility should I expect?
- Based on the Average True Range indicator of $24.60, a typical daily range is around $50. This means moves between $4,188 and $4,238 are within normal volatility.
- What would cause gold to crash today?
- A sharp, unexpected rise in the US Dollar Index or US Treasury yields, likely triggered by hawkish Fed commentary or surprisingly strong economic data, could force a sell-off. A break below $4,136 support would accelerate downward momentum.
Trading Gold (XAU/USD) carries significant risk of loss and is not suitable for all investors. This content is for informational purposes only and does not constitute financial advice. Always conduct your own research and trade responsibly.