
The gold price has decisively broken through the psychological $4,800 barrier during the early American session, currently trading at $4,802.25. This move comes as Societe Generale analysts highlight the resumed strength of the Chinese Yuan, with USD/CNY nearing 6.80 for the first time in three years. With China-linked tankers transiting the Strait of Hormuz, geopolitical risk premium is being priced back into the market, creating a bullish undercurrent just as New York liquidity floods in.
Last week's data showed persistent inflation pressures, keeping Fed expectations in check. As we head into the core of today's American session, the focus shifts to whether institutional buyers can sustain this momentum and challenge the immediate resistance levels. This session's price action will be critical in determining if this is a genuine breakout or a bull trap before a deeper retracement.
Gold Market Overview
Macro Context
The Dollar Index (DXY) remains a key counterweight to gold's ascent. While the greenback has softened slightly on the CNY strength narrative, US Treasury yields are holding firm, reflecting the market's reassessment of the Federal Reserve's rate path. The recent inflation data confirms the 'higher for longer' narrative is intact, which typically caps gold's upside. However, the geopolitical overlay from the Strait of Hormuz is injecting a fresh safe-haven bid that is overriding traditional rate dynamics for now.
Positioning data shows speculators have been adding to long gold futures positions, but not at extreme levels. This suggests there is room for additional buying if the technical breakout is confirmed. The interplay between a firm dollar, stable yields, and rising geopolitical risk creates a complex backdrop where gold is finding selective, news-driven demand.
Session Outlook
The American session brings the deepest liquidity and often the most decisive moves. With the London fix behind us, New York traders are evaluating whether to chase this breakout or fade it. The expected daily volatility range, based on the ATR(14) of $16.63, suggests a potential session range between roughly $4,785 and $4,819.
The key trigger will be any fresh headlines regarding Middle Eastern geopolitics or sudden shifts in currency markets. Without a major US data release today, price action will be technically driven and sensitive to order flow. Watch for a test of the $4,846 level; a failure there could see profit-taking accelerate.
Technical Analysis
The technical landscape paints a picture of short-term bullish momentum within a longer-term consolidation. The critical levels from our live indicator suite provide a clear roadmap for today's session.
Moving Average Structure
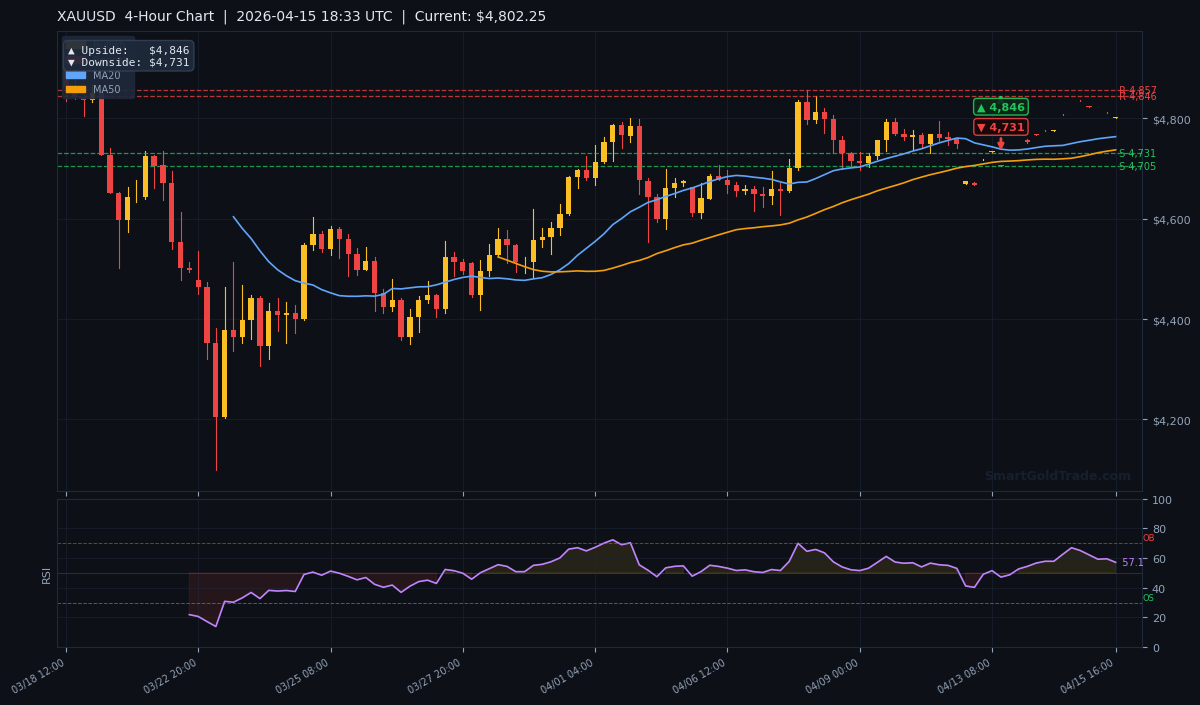
The moving average alignment shows a bullish short-to-medium-term setup. The price at $4,802.25 sits above both the MA20 at $4,763.71 and the MA50 at $4,737.32. This confirms the short-term bullish momentum. However, the price remains below the long-term MA200 at $4,834.95, which places the broader trend in bearish territory. The structure where the MA20 > MA50 confirms the building bullish momentum on the lower timeframes.
RSI and Momentum
The RSI(14) reads 57.1, firmly in neutral territory. This is crucial. It indicates there is no immediate overbought condition, giving the rally room to extend before becoming exhausted. A move above 60 would signal strengthening momentum, while a drop below 50 could indicate the bullish move is stalling. The current RSI level supports the case for further upside exploration during this session.
Key Price Levels
Our system identifies precise support and resistance zones. Immediate resistance is at R1: $4,857.30, with a closer, more tactical resistance at R2: $4,845.67. On the downside, the first line of defense is S1: $4,730.58, followed by S2: $4,705.44. The ATR(14) of $16.63 implies today's expected trading range. A break above R2 would target the daily upside pivot of $5,250, while a failure at S1 opens the door to the 4-hour downside pivot at $4,731.
| Timeframe | Upside Target | Downside Target |
|---|---|---|
| Daily | $5,250 | $5,014 |
| 4-Hour | $4,846 | $4,731 |
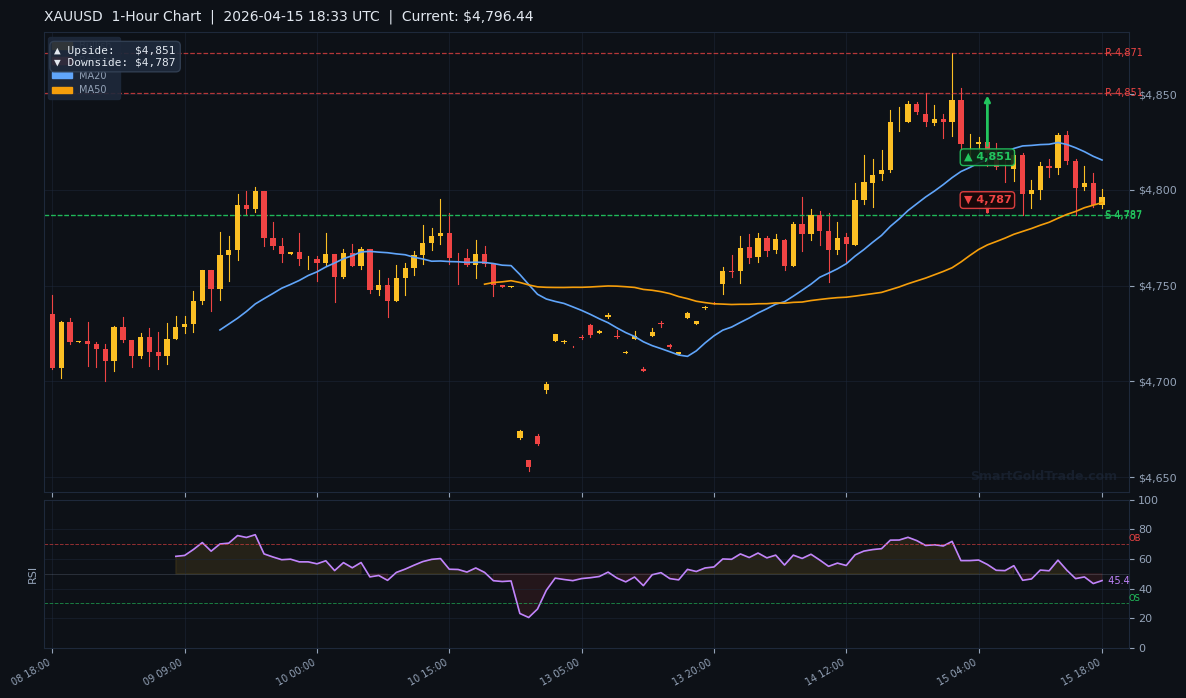
| 1-Hour | $4,851 | $4,787 |
Fundamental Drivers
The primary fundamental driver this session is the intersection of currency markets and geopolitics. The strengthening Chinese Yuan, nearing 6.80 against the USD, is a significant undercurrent. A stronger CNY reduces the local price of dollar-denominated gold, potentially stimulating physical demand from the world's largest consumer. This currency move, coupled with the transit of China-linked tankers through the volatile Strait of Hormuz, directly injects a risk premium.
The market is interpreting these tanker movements as a potential flashpoint, increasing gold's appeal as a geopolitical hedge. This has temporarily overshadowed the headwind from a still-resilient US dollar and firm Treasury yields. The Fed's stance remains hawkish, but for now, the safe-haven narrative is taking precedence during the session.
Key Event to Watch
The most important scheduled event this week remains any official commentary from Federal Reserve officials. While no major data is due today, speeches from FOMC members can cause sharp recalibrations of rate expectations. A hawkish reiteration of the 'higher for longer' policy could quickly reverse gold's geopolitical gains by strengthening the dollar and lifting real yields. Traders should monitor the Fed's Waller or Williams if they speak.
Devil's Advocate
The bullish case rests on geopolitics, but this is a fickle driver. Should tensions around the Strait of Hormuz show signs of de-escalation, or if the Yuan strength proves fleeting, the entire rally could unravel quickly. The key reversal level to watch is the $4,730.58 support (S1). A decisive hourly close below this level would break the short-term bullish structure and likely trigger a flush down toward the $4,705.44 (S2) area.
Furthermore, the price remains beneath the formidable MA200 at $4,834.95. A rejection at this major moving average would be a classic technical signal for bears to re-enter, confirming the longer-term downtrend is still intact. This scenario would flip the bias from cautiously bullish to resolutely bearish.
Trading Strategy for American Session
For active traders, the setup offers a defined risk opportunity. The preferred bias is cautiously bullish, aiming for a test of the 4-hour resistance. An entry zone exists on a shallow pullback to $4,790-$4,795, aligning with the 1-hour downside pivot and prior resistance-turned-support.
Place a stop loss below the session low and the S1 level at $4,725, using the ATR value to justify the width. The primary take-profit target is the 4-hour upside pivot at $4,846. A secondary, more aggressive target is the 1-hour upside pivot at $4,851. This yields a risk-reward ratio exceeding 1:2.5 if targeting $4,846. For those seeking a halal gold trading approach, this strategy focuses on spot price movement without leverage.
Alternatively, a break and hold below $4,787 invalidates the long setup and presents a short opportunity targeting $4,731. Patience for a clear trigger is paramount in this elevated volatility environment.
Key Takeaways
- The gold price is trading bullishly in the short term at $4,802.25, above its MA20 and MA50.
- Key immediate resistance is clustered between $4,845.67 and $4,846, the 4-hour upside target.
- A break below $4,730.58 (S1) support would invalidate the current bullish structure.
- The RSI at 57.1 shows neutral momentum, allowing room for the rally to extend.
- Geopolitical tension and CNY strength are the primary fundamental drivers overriding Fed policy headwinds today.
- The American session's expected range, based on an ATR of $16.63, is approximately $4,785 to $4,819.
Conclusion
The gold price has the wind at its back during the American session, propelled by a potent mix of technical breakout and geopolitical anxiety. The path of least resistance points toward a test of the $4,846 resistance level. However, traders must remain acutely aware of the fragile foundation of this move. The longer-term trend, as defined by the MA200, remains bearish, and the Fed's hawkish posture is a persistent threat. Success in this environment depends on disciplined adherence to the key levels outlined: targeting $4,846 while respecting the invalidation point at $4,730.58. The session's close will be telling for whether this is a sustainable leg higher or another false dawn.
Frequently Asked Questions
- What is the main resistance level for gold right now?
- The most immediate and significant resistance is at $4,846, which is the 4-hour upside pivot target. Above that, the daily MA200 at $4,834.95 and the 1-hour target at $4,851 create a strong resistance band.
- Where should I place a stop loss if buying gold?
- For a long position, a logical stop loss is placed below the key $4,730.58 support level (S1). This allows for normal market noise while protecting against a structural breakdown of the bullish setup.
- Is the RSI showing gold as overbought?
- No. The RSI(14) at 57.1 is in neutral territory. It typically needs to exceed 70 to be considered overbought, suggesting there is potential for further upward movement before becoming exhausted.
- What would cause gold to reverse and fall sharply today?
- A de-escalation of geopolitical headlines combined with a rebound in the US Dollar Index (DXY) could trigger sharp selling. Technically, a break below the $4,787 level (1-hour downside pivot) would be the first warning sign of a deeper pullback toward $4,731.
Trading Gold (XAU/USD) carries significant risk of loss and is not suitable for all investors. This content is for informational purposes only and does not constitute financial advice. Always conduct your own research and trade responsibly.