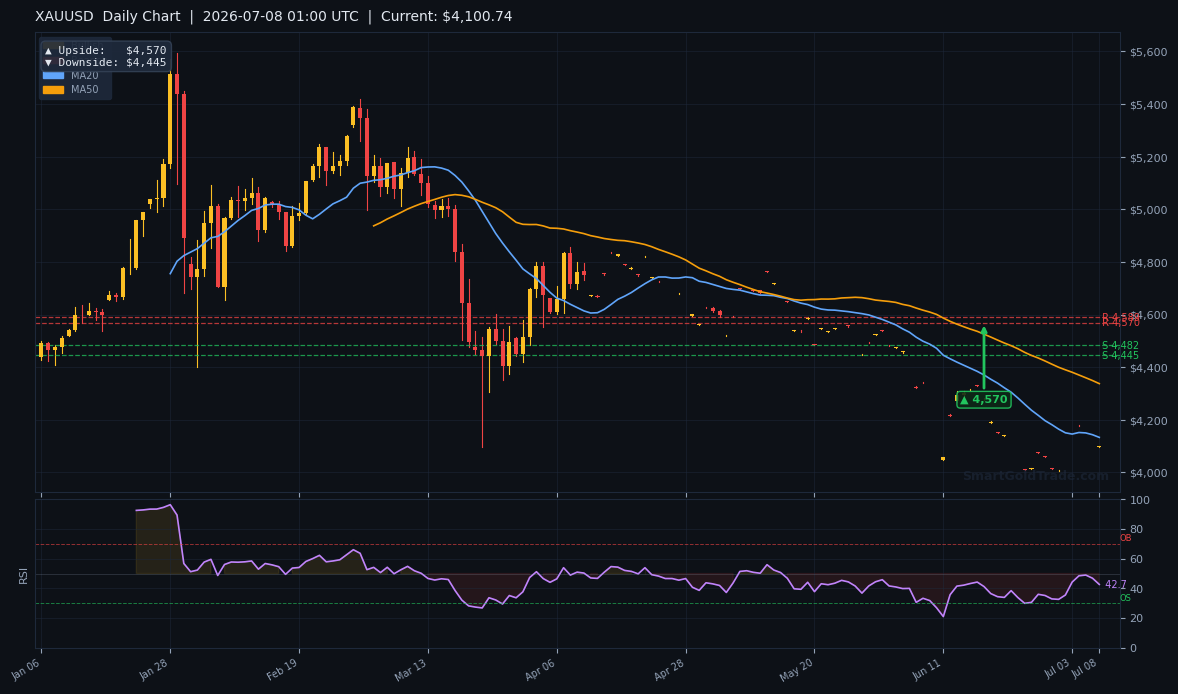
Gold price opens the Asian session at $4,118.94 per troy ounce, sitting comfortably above the critical $4,084 MA50 support. Spot gold’s overnight drift was quiet, with the metal now trading near session highs as Wednesday’s Asia-Pacific trade gets underway. Tuesday’s PBOC yuan fix at 6.8054 briefly softened the dollar but didn’t generate a lasting bid. With Japan on holiday and no tier-one data due, liquidity will be dangerously thin — a classic trap for anyone chasing breakouts in a low-volume environment.
The market is quietly laying a foundation; the real test arrives later when US weekly jobless claims could reprice Fed expectations and Treasury yields. For now, the bias leans cautiously bullish above $4,084, but swift reversals are entirely possible given the lack of sustained momentum. Traders who respect the overnight range and wait for a confirmed volume push stand a far better chance of navigating today’s gold price action profitably.
Gold Market Overview
Macro Context
The US dollar index (DXY) remains stuck near 102.50, unable to rally after last week’s mixed ISM figures. The 10-year Treasury yield slipped to 4.18%, a clear sign that bond traders are pricing in a slower Federal Reserve rate path. CME FedWatch now assigns a 65% probability to a September rate cut, up from 58% last week, providing a gentle tailwind for the gold price. Geopolitically, Eastern Europe and the Middle East simmer without fresh escalation, so safe-haven flows are absent. Gold is drawing strength from a softening dollar and steady rate-cut bets, not panic buying.
Interestingly, real yields remain negative across short and medium maturities, which historically supports a floor under gold. Inflation expectations have not spiked, but the mere fact that the Fed’s next move is likely to be a cut rather than a hike is enough to keep gold price well bid above the $4,000 psychological mark. The CME data also shows that market participants are now assigning a non-trivial chance to a second cut before year-end, further anchoring the non-yielding metal.
Session Outlook
Asian hours typically compress gold price into a tight range, and today’s holiday-thinned order books will exaggerate that tendency. The 1-hour pivot targets frame the immediate boundaries: upside at $4,169 and downside at $4,137. Any move beyond these levels on low volume is highly likely to reverse. A sustained push above the 4-hour resistance at $4,182 would demand a genuine catalyst — something unlikely before the US session. Traders should treat breakouts with deep scepticism and insist on a retest of the breakout level on normal volume before committing.
Why the $4,084 Level Matters
The 50-day moving average at $4,084 has served as a dynamic support throughout the past two months, absorbing every dip. Each time gold price has tested that floor in recent weeks, buyers have stepped in aggressively, often within minutes. A daily close below $4,084 would be the first genuine bearish signal in weeks and would open the door to a rapid move toward the 100-day MA near $3,960. Until that happens, the path of least resistance remains higher, but traders must watch the daily close carefully.
Technical Landscape
Beyond the headline MA50, a cluster of intraday supports lies between $4,100 and $4,108, including the Asian session’s volume-weighted average price. On the topside, the $4,182–4,200 zone is the main barrier — a region that has rejected gold price three times since late June. A daily close above $4,200 would signal a breakout from the multi-week consolidation range and could quickly attract momentum traders targeting the all-time high near $4,420.
Meanwhile, the 4-hour chart reveals a modest bullish divergence in the RSI, with the indicator making a higher low while gold price consolidated. This setup often precedes a short-covering rally, particularly if US jobless claims surprise to the upside later this week. Sentiment indicators show retail long positions are still crowded, however, suggesting that any upward move could be slow and choppy rather than vertical.
Macro Drivers in Depth
Fed Policy and Rate-Cut Expectations
Markets are firmly in “bad news is good news” mode when it comes to gold price. Any data that raises the odds of a September cut — soft employment figures, disappointing retail sales, or a dovish Fed speech — acts as a green light for gold buyers. Conversely, strong economic prints tend to knock gold back only modestly as long as the overall cutting cycle remains priced in. The upcoming jobless claims release will be the week’s first litmus test for this thesis.
US Dollar and Global Yields
The DXY’s inability to reclaim the 103.00 handle despite hawkish-leaning Fed speak indicates that the dollar bull run is exhausted. Real yields in the US, while still positive on the longer end, are compressing rapidly. In Europe and Japan, central banks are slowly normalizing policy, applying further pressure on the greenback. For gold price, this cocktail of a flat-to-falling dollar and compressed front-end yields is nearly ideal.
Geopolitical Backdrop
While no new flashpoints have emerged, the global risk map remains dotted with potential disruptors. Any sudden headline from the Middle East or Eastern Europe would immediately refocus attention on gold’s safe-haven credentials. In the current low-volatility environment, such a shock could trigger a rapid $50–$70 spike in gold price, overwhelming thin Asian order books. Prepared traders keep geopolitical alert feeds close at hand even on quiet session days.
Applying Gold Price Analysis in a Halal Way
SmartGoldTrade’s approach to the market ensures that every strategy built around the gold price remains fully Shariah-compliant. Our halal gold trading platform offers spot gold with physical backing, no leverage, no swaps, and no overnight interest — just immediate ownership of fractional troy-ounce lots. When you analyze support and resistance levels as outlined above, you can execute entries and exits without a trace of riba, because each trade transfers real metal into your name.
For those who prefer a hands-off approach while still participating in gold’s upside, mudarabah investment plans allow you to profit from gold price movements through a professionally managed, Shariah-audited partnership. With a minimum of just $10 and plans ranging from 3 to 12 months, this model aligns perfectly with Islamic finance principles while capturing long-term trends. While our technical analysis here focuses on short-term levels, the mudarabah plans leverage the same deep market research to generate consistent returns for investors who’d rather let experts handle the charts.
Whether you trade actively or invest passively, anchoring your decisions in sound gold price analysis and riba-free execution is the halal way to build wealth in precious metals. Even a quiet session like today’s can offer opportunities for patient traders who follow the levels and respect the low-liquidity risks.
Tools to Refine Your Entry and Exit
Navigating thin Asian markets requires precise timing. Combining our technical outlook with professional gold trading signals can give you an extra edge, especially when breakouts lack conviction. Real-time alerts that map to exact support and resistance zones help filter out noise and keep you on the right side of the gold price intraday swings. When the US session opens and volume returns, having a well-defined signal structure can turn a cautious bias into executable trades.
FAQ
1. What is driving the gold price today?
The gold price at $4,118.94 is being supported by a weaker US dollar, falling Treasury yields, and elevated expectations for a Federal Reserve rate cut in September. Thin Asian liquidity because of a Japanese holiday is limiting immediate volatility, but the macro backdrop remains bullish.
2. How do I trade gold without interest or leverage in Islam?
You can trade spot gold through a Shariah-compliant platform that offers physical ownership, no swap fees, and fractional lots. SmartGoldTrade’s halal gold trading facility ensures each trade represents real metal, not a CFD, eliminating riba entirely while letting you benefit from gold price movements.
3. What key gold price levels should I watch this week?
Immediate support sits at $4,084 (50-day MA), with resistance at $4,182–4,200. A break of either level on strong volume would likely determine the medium-term direction. Intraday traders should also monitor $4,137 (session low pivot) and $4,169 (session high pivot).