Gold price hovers near $3,996 as the American session presses on through June 24, 2026, with sellers retaining control after a week of hawkish Federal Reserve commentary. This morning’s Argentina GDP data added a layer of pressure — first‑quarter growth came in at 2.3% year‑on‑year, above the 1.7% forecast, giving the dollar a modest risk‑on nudge and sending bullion through the $4,000 floor toward session lows near $3,988. The metal has carved a series of lower highs since yesterday’s European close, leaving bulls scrambling for a foothold at $3,996. With no major US data on the docket, the session hinges on whether deeply oversold conditions can spark a relief rally or whether bears will force a test of the $3,988 session low.
Gold Price & Market Overview
Macro Context
The US Dollar Index trades near 105.80, supported by a 10‑year Treasury yield holding above 4.55%. With the fed funds rate at 5.75%, the opportunity cost of holding non‑yielding gold remains painfully high, keeping the gold price under sustained pressure. Hawkish Fedspeak in recent days reinforced market expectations for at least one more rate hike before year‑end, capping any sustained gold upside. Geopolitical tensions are simmering but not intense enough to trigger a meaningful safe‑haven bid. As a result, the macro backdrop continues to favour the greenback over gold, keeping the yellow metal pinned below its key moving averages.
Session Outlook
The American session typically injects fresh liquidity and broader participation, often amplifying the European trend. Today, traders will watch whether the gold price holds above the overnight low near $3,988 or whether stops trigger a move toward the ATR‑implied floor. The ATR of $25.59 suggests an intraday range roughly between $3,975 and $4,026, though a break of either boundary could extend the move quickly. With no major economic data due, price action will be driven by technical flows and any surprise comments from Philadelphia Fed President Harker, who is scheduled to speak later in the session.
Technical Analysis
Moving Average Structure
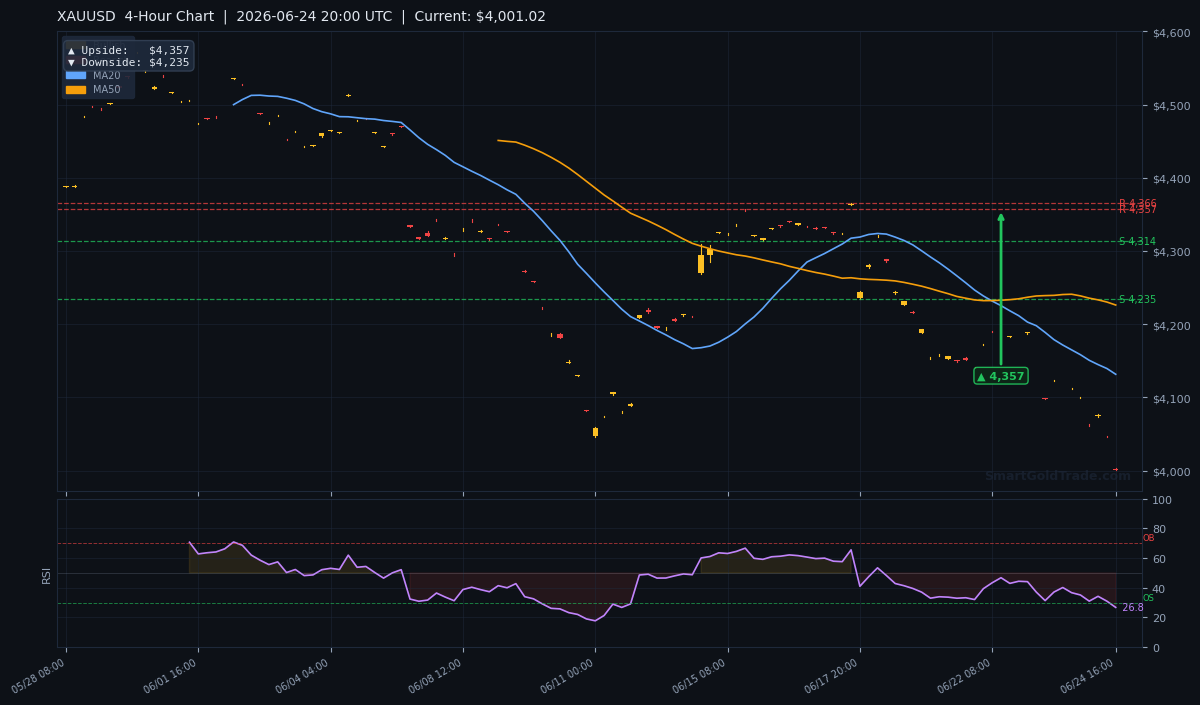
The gold price at $3,996.39 sits beneath every major moving average on the 4‑hour chart. The short‑term MA20 rests at $4,131.63, the medium‑term MA50 at $4,226.19, and the long‑term MA200 at $4,416.83. This alignment confirms a fully bearish structure across all timeframes. The EMA stack reads MA20 < MA50, reinforcing short‑term downward pressure. Sellers have successfully defended every attempt to reclaim the $4,091 level since yesterday, making it the line in the sand for any bullish comeback.
RSI and Momentum
The 14‑period RSI reads 26.8, deep in oversold territory. While this signals extreme bearish momentum, it also raises the probability of a sharp mean‑reversion bounce in the gold price. However, oversold readings in a downtrend can persist for days, so traders should wait for a clear catalyst before calling a bottom. A break back above 30 on the RSI would be the first hint that buying pressure is returning.
Key Price Levels
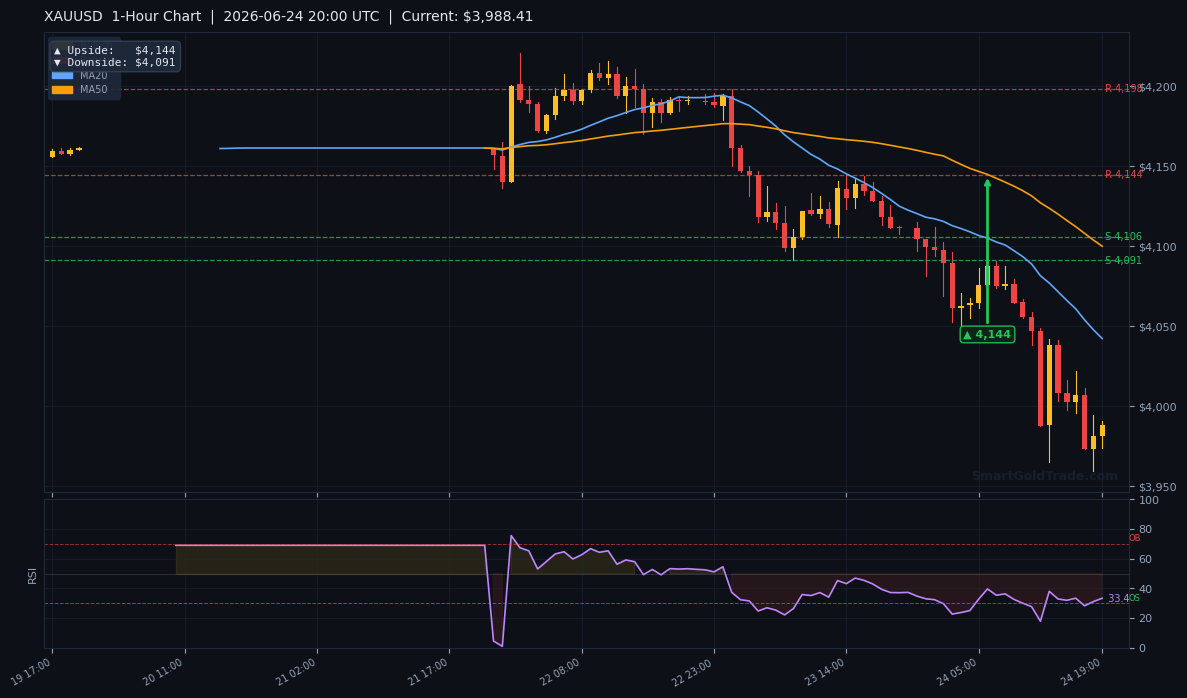
With the gold price holding near $3,996, the $4,091 level — formerly a 1‑hour support — has flipped into immediate resistance. Below current price, the next visible demand zone sits near the session low of $3,988 and the psychological $4,000 barrier. The prior swing support S2 at $4,234.79 now acts as overhead resistance, while R1 at $4,365.61 marks a stiffer ceiling. The daily ATR of $25.59 suggests that any breakout from the morning’s consolidation could stretch $25 to $30, making the $4,026 and $3,975 levels realistic near‑term targets.
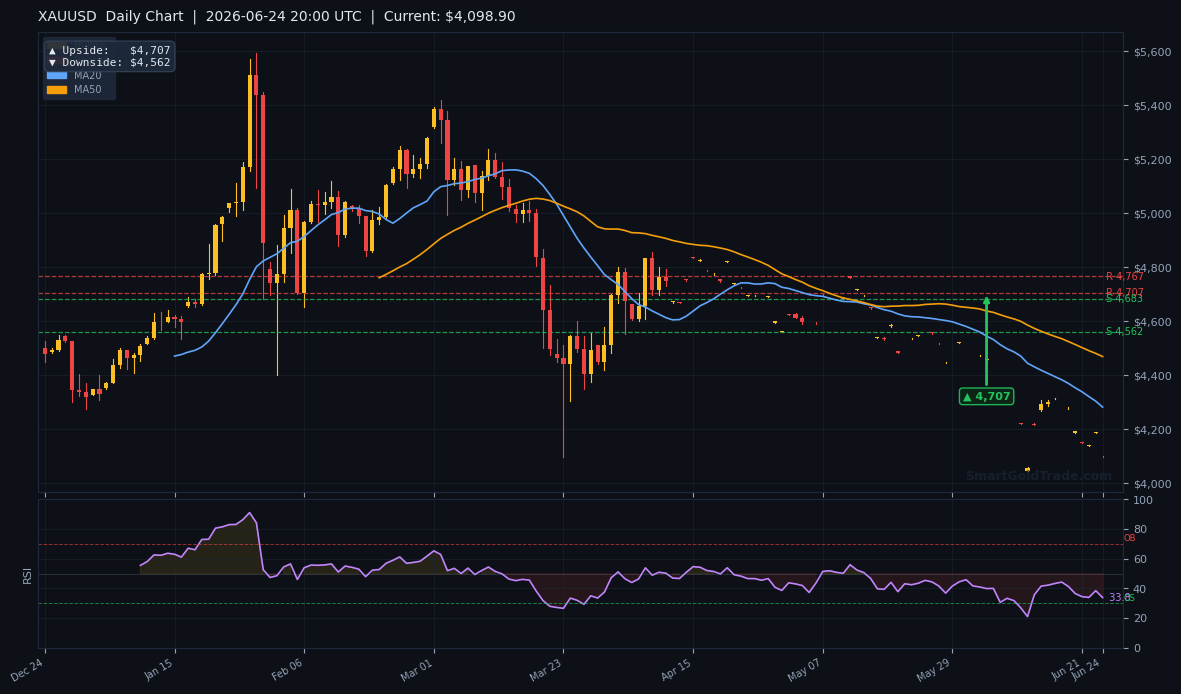
| Timeframe | Upside Target | Downside Target |
|---|---|---|
| Daily | $4,707 | $4,562 |
| 4‑Hour | $4,357 | $4,235 |
| 1‑Hour | $4,144 | $4,091 |
Fundamental Drivers
This morning’s sole economic catalyst came from Argentina, where Q1 GDP beat estimates, printing 2.3% against a 1.7% consensus. While not a US‑centric event, it lent a marginal risk‑on tone to early trade, helping the dollar and pressuring the gold price. The bigger story remains the Fed’s hawkish posture — minutes from the June meeting reiterated that policymakers see no urgency to cut rates, keeping real yields elevated. The inverse correlation between the DXY and gold price continues to hold, with any up‑move in the dollar index likely to send XAU/USD toward the $3,975 region.
Key Event to Watch
All eyes now turn to Friday’s US Core PCE Price Index for May, the Fed’s preferred inflation gauge. A hotter-than-expected print could cement expectations for a July rate hike, driving the dollar higher and the gold price toward the daily downside target of $4,562. A softer number might offer gold a brief reprieve, allowing a test of $4,144, but the broader trend would remain downward until the metal reclaims at least one major moving average.
Devil’s Advocate
The bearish thesis collapses if gold price stages a convincing bounce from the oversold RSI of 26.8. Should buyers defend $3,996 and push above the $4,091 resistance, a short‑squeeze toward the 1‑hour upside target of $4,144 becomes the base case. A close above $4,144 would open the door to $4,235 and potentially the 4‑hour upside target of $4,357. The level at which bears must reconsider is a daily settlement beyond $4,234.79, the former S2 support turned resistance.
Trading Strategy for American Session
Given the oversold RSI and the tendency for mean reversion during the New York cross, a tactical long play from support offers a favourable risk‑reward. Entry is preferred in the $3,995–$4,005 zone, with a stop loss at $3,970 — just below the ATR‑implied session low and under the current live price baseline of $3,988.21. Take profit 1 sits at $4,091, the 1‑hour pivot, and take profit 2 at $4,144, the hourly upside target. For traders who prefer a hands‑off approach, copy trading allows you to mirror expert gold traders automatically, capturing these setups without manual execution.
Short entries should wait for a confirmed break below $3,988 with a stop above $4,001, targeting $3,975 initially. Use the ATR of $25.59 to gauge whether a breakout is genuine — a candle close below $3,988 with volume may signal acceleration toward the daily downside target of $4,562 later this week. Real‑time alerts such as professional gold trading signals can help confirm entry points as conditions evolve. And if you’re managing risk on a platform that aligns with Islamic finance, SmartGoldTrade’s halal gold trading lets you trade spot gold with no swaps or leverage — owning the underlying metal outright.
Key Takeaways
- Gold price trades at $3,996.39, below all three key moving averages, signalling persistent bearish momentum.
- RSI at 26.8 is deeply oversold, hinting at a possible snap‑back rally toward $4,091.
- Immediate resistance stands at $4,091, with a stronger hurdle at $4,144.
- Support is precarious around $4,000, with a breakdown exposing $3,988 and $3,975.
- The ATR of $25.59 points to an intraday range between $3,975 and $4,026.
- Friday’s Core PCE release is the week’s main event risk and could extend the $4,091 breakdown to $4,235 or trigger a squeeze higher.
Conclusion
The gold price remains pinned under heavy bearish pressure, with the $4,000 breakdown intensifying the sell‑off and turning $4,091 into formidable resistance. Yet the oversold RSI at 26.8 warns against chasing shorts blindly — a sharp relief rally could unfold if $3,996 holds. For the rest of the American session, the battle line is drawn at $3,988 on the downside and $4,144 on the upside. A breach in either direction will likely set the tone for the remainder of the week, especially with Friday’s inflation data looming. Traders should stay nimble, sizing positions according to the ATR of $25.59, and be ready for a rapid shift in sentiment should the RSI climb back above 30.
While short‑term trading strategies can capitalize on intraday swings, many Shariah‑conscious investors take a longer view by accumulating physical gold or joining Islamic partnership pools. Holding certified coins and bars can provide a stable store of value that aligns with Islamic financial principles, insulating wealth from currency debasement without exposure to riba or excessive speculation.
Frequently Asked Questions
- What is the gold price right now?
- As of the June 24, 2026 American session, gold price stands at $3,996.39, just under $4,000 and testing support near $3,988.
- What are the key support levels for XAU/USD today?
- Immediate support sits at the round number $4,000 and the session low of $3,988.21. A convincing break below that would expose the ATR‑based swing low near $3,975.
- Is gold oversold?
- Yes, the 14‑period RSI reads 26.8, which is firmly in oversold territory. This indicates extreme selling pressure but also raises the odds of a bounce toward $4,091.
- How does the Argentina GDP data impact gold?
- Argentina’s better‑than‑expected Q1 GDP of 2.3% gave a mild lift to risk appetite and the dollar, temporarily weighing on gold price. The effect is small but added to the intraday bearish tone.
- Where can I set a stop loss for a long trade?
- A long entry from the $3,995–$4,005 zone can use a stop at $3,970, just beneath today’s ATR‑implied floor and below the live price baseline of $3,988.21.
Risk Disclaimer: Trading Gold (XAU/USD) carries significant risk of loss and is not suitable for all investors. This content is for informational purposes only and does not constitute financial advice. Always conduct your own research and trade responsibly.