Gold price is hovering near $4,099 during the Asian session on June 24, 2026, a level that looks uncomfortable on paper. Every major moving average sits well above current trade, and the trend structure screams bearish. Yet the smart money isn’t shorting blindly this morning — it’s watching for a countertrend move. This morning’s Japan Jibun Bank Manufacturing PMI for June printed at 54.9, beating the 54.5 forecast, but the data barely moved XAU/USD. That non-reaction, in thinning liquidity, often precedes a sharp correction. This session sets up a potential rebound that could catch late shorts off guard.
Gold Price Market Overview
Macro Context
The US Dollar Index remains elevated near multi-week highs, keeping gold price anchored below the $4,200 handle. US Treasury yields have held firm after last week’s hawkish Federal Reserve rhetoric, which reiterated that rate cuts are still months away. Geopolitically, no fresh escalation is driving safe-haven bids, so gold is left to trade on technicals and positioning. The macro backdrop is not gold-friendly, but that’s exactly why a short-term bounce becomes a high-probability contrarian setup — markets tend to punish crowded trades when no fresh bearish catalyst appears.
Session Outlook
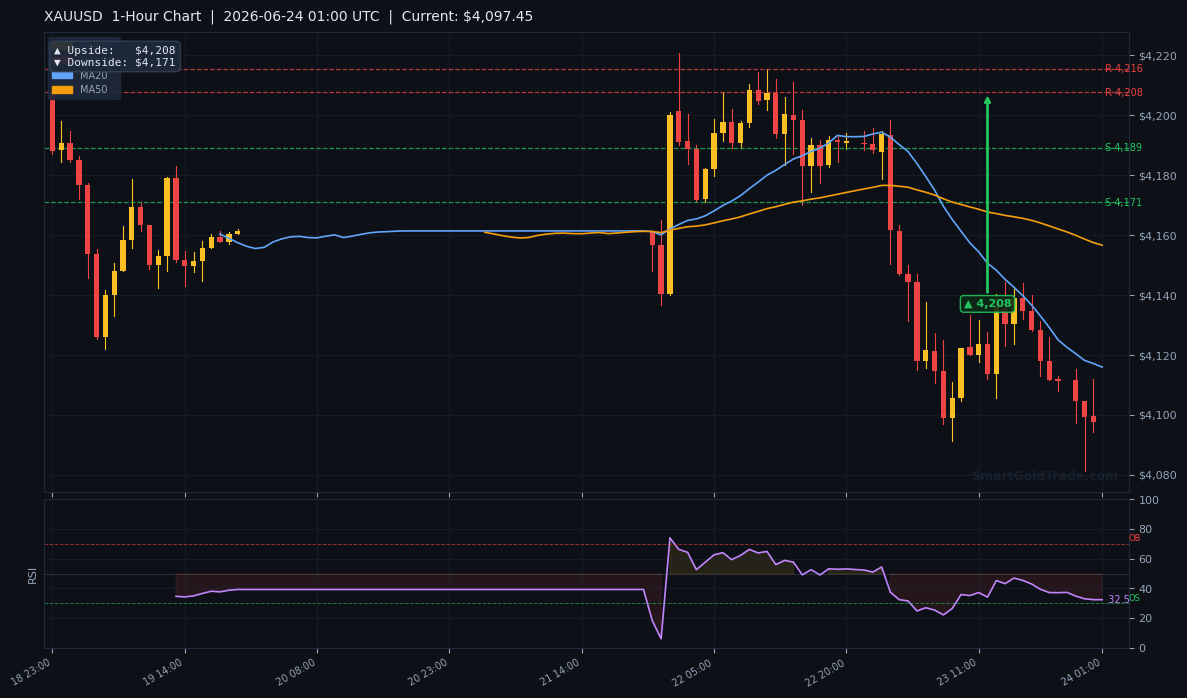
The Asian session is notorious for false breaks and low-volume whipsaws. Today’s liquidity is thinner than usual, with no major economic releases scheduled before the European open. Gold price is likely to respect the $4,171–$4,208 range, the 1‑hour pivot levels drawn from overnight price action. Expect choppy, two-way flow; any dip toward $4,171 that holds will attract short-covering. Chasing a breakout before London enters the market is a mistake I’ve seen too many traders make. Wait for structure to confirm.
Technical Analysis
Moving Average Structure
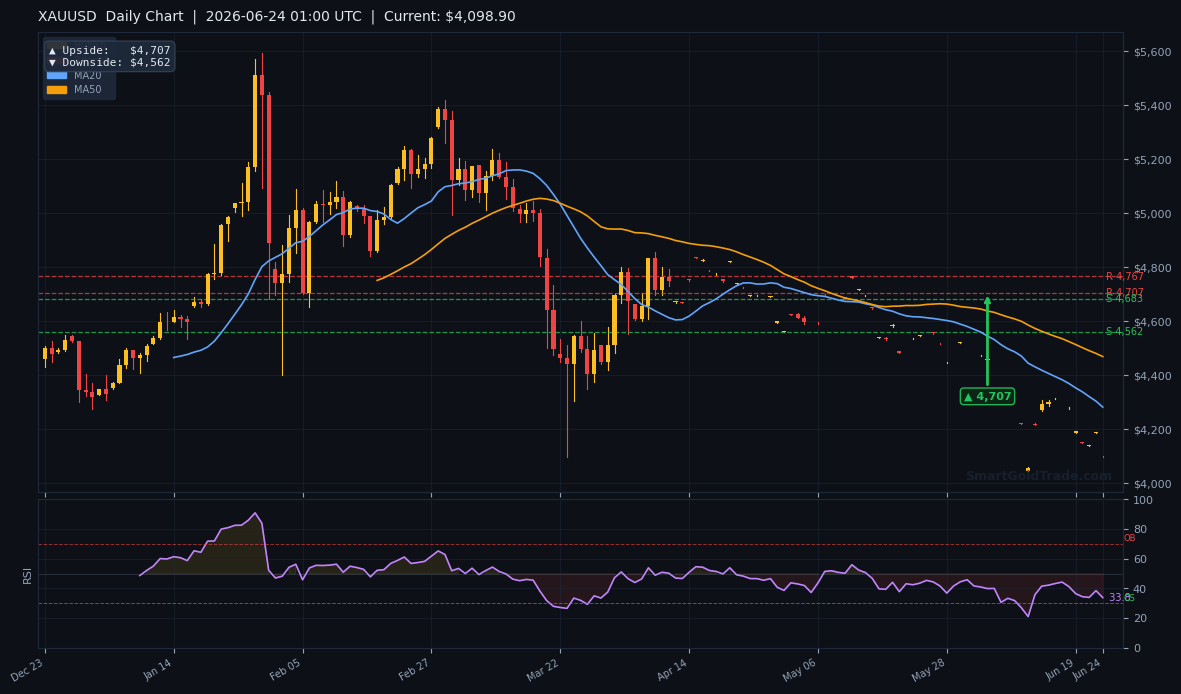
The moving averages paint an undeniably bearish picture. MA20 stands at $4,158.37, MA50 at $4,238.68, and the MA200 at $4,429.77. Price at $4,099.26 trades below all three, and the EMA structure shows MA20 below MA50 — short-term bearish pressure confirmed. Normally this would be a sell-on-rallies environment. However, the distance between price and the MA20 is roughly $59, which is getting stretched. Countertrend bounces tend to originate from such gaps when momentum stops accelerating lower.
RSI and Momentum
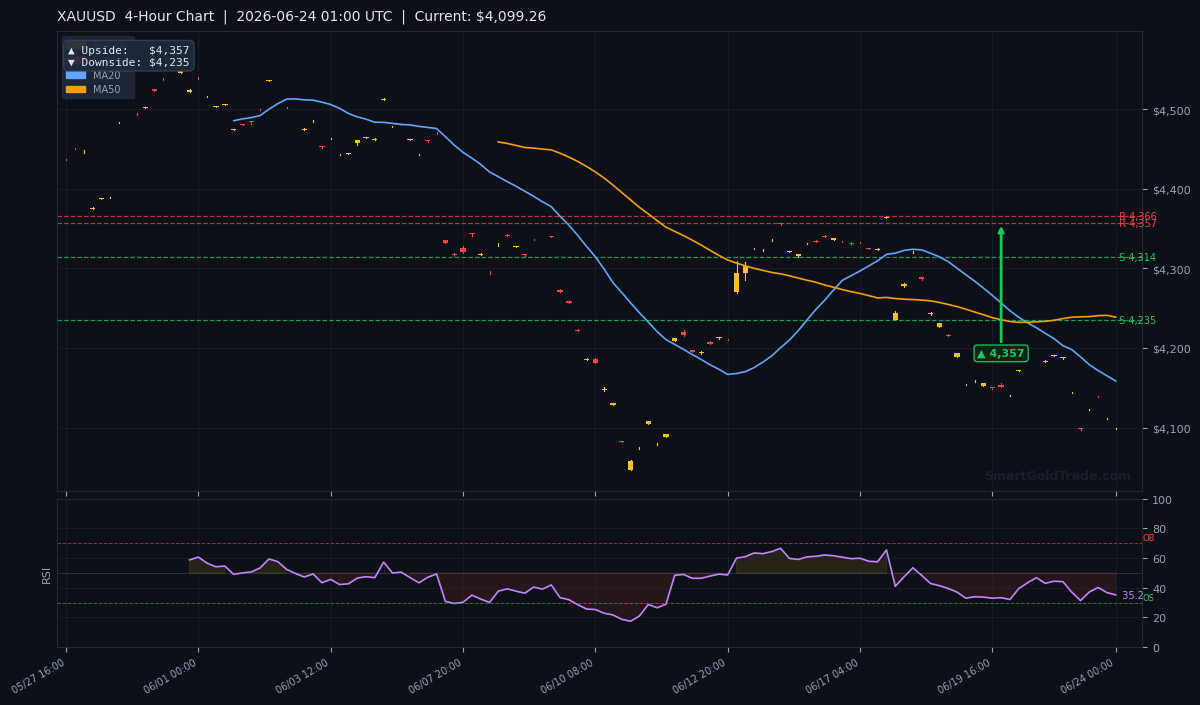
The 14-period RSI reads 35.2, sitting in neutral territory but just a hair above oversold. It’s not yet at 30, but the downward slope has flattened, suggesting selling momentum is fading. Divergence hasn’t appeared on the H4 chart yet, but if gold price makes a lower low below $4,099 while RSI prints a higher low, that would be a strong signal for a bounce. For now, the RSI tells us that bears are losing conviction even if the trend still points south.
Key Price Levels
Calculated support and resistance levels reflect the broken market structure. S1 sits at $4,313.77 and S2 at $4,234.79 — both are now above price, functioning as resistance. R1 is $4,365.61, and R2 at $4,356.90. The more actionable levels this session come from the pivot arrows on the charts: on the 1‑hour, upside $4,208 and downside $4,171; on the 4‑hour, upside $4,357 and downside $4,235. The ATR(14) of $21.17 suggests a daily volatility envelope of approximately $4,078–$4,120, so any move beyond those extremes today would be unusual without a fresh catalyst.
Fundamental Drivers
The only notable release in the last 24 hours was the Japan Jibun Bank Manufacturing PMI, which came in at 54.9 for June, above the 54.5 forecast. A stronger manufacturing print in the world’s third-largest economy can marginally support physical gold demand in yen terms, but the immediate impact on dollar-denominated XAU/USD is usually limited. The real driver this week remains the broader US dollar trajectory, which has been the anchor around gold’s neck. No major US data is due today, leaving the door open for positioning flows to dictate price action.
Key Event to Watch
Later this week, US Durable Goods Orders and the final Q1 GDP revision will cross the wires. If either print surprises to the downside, the DXY could slip and give gold price the fundamental excuse needed to test $4,208. Until then, the absence of bearish headline risk is itself a short-term tailwind — markets often recover by default when selling dries up.
Devil’s Advocate
The main risk to a bounce is a clean break of the $4,171 support level on the 1‑hour chart. If that floor cracks, it would signal that sellers have absorbed all the latent demand and are ready to press toward the $4,100 round number. Worse, if the RSI pushes below 30 and price accelerates through $4,099, the bearish moving average structure would reassert itself violently. In that scenario, any long trade becomes invalid immediately; the trend would be too strong to fade. The key reversal level for the contrarian thesis is $4,171 — below it, the narrative flips back to full bear trend.
Trading Strategy for Asian Session
The contrarian setup relies on a confirmed hold of $4,171. I’m looking for a 15-minute candle closure above that level, ideally with a wick rejection, before committing a long position. Entry zone would be $4,175–$4,180, a range that offers participation near the support without chasing the low. Stop loss should rest below $4,150, roughly one ATR beneath the support, giving the trade enough breathing room for thin-liquidity noise. The initial take-profit target is the 1‑hour upside pivot at $4,208, yielding a risk-reward ratio near 1:1.5. If gold price breaks above $4,208 on a 1‑hour close, partial profits can be booked and the stop raised to breakeven with a secondary target at the $4,235 4‑hour resistance.
For traders who prefer additional confirmation, professional gold trading signals can offer real-time entry and exit alerts during these low-liquidity windows. Position sizing must be conservative; the ATR of $21.17 warns that volatility can expand suddenly. Do not chase a move that extends beyond $4,208 before the European open.
For traders wanting to act on this gold price setup within Islamic guidelines, halal gold trading at SmartGoldTrade offers interest-free spot trading with physical ownership — no swaps, no leverage. That way, your technical strategy stays ethically aligned while you trade the same market moves.
Key Takeaways
- Gold price trades at $4,099, below all key moving averages, but RSI at 35.2 hints at slowing bearish momentum.
- The 1‑hour pivot support at $4,171 is the session’s make-or-break level; holding it opens a rebound to $4,208.
- Asian session liquidity is thin, increasing the probability of short-covering spikes above $4,200.
- A daily-range projection based on ATR $21.17 places upper and lower bounds near $4,120 and $4,078.
- The next high-impact US data arrives later this week; until then, positioning flows will dominate gold price action.
- A breakdown below $4,171 invalidates the contrarian bounce and targets the $4,100 psychological floor.
Conclusion
The morning chart looks bearish, but the setup underneath is building for a short-term recovery. Gold price sitting well below the MA20 at $4,158.37 and the MA50 at $4,238.68 invites late shorts to pile in — exactly the condition that produces violent reversals when momentum stalls. My base case for the Asian session is a defence of $4,171 and a gradual grind toward $4,208. If that level breaks with volume, the $4,235 4‑hour pivot becomes the next magnet. Keep trades small, stops tight, and don’t get married to the bearish trend until it proves itself again.
FAQ
Is gold price bearish or bullish right now?
On the daily and 4‑hour charts, gold price remains in a bearish structure, trading below the MA20 at $4,158 and MA50 at $4,238. However, short-term oversold conditions and thin liquidity create room for a countertrend bounce toward $4,208.
What is the key support to watch this Asian session?
The critical support is $4,171, the 1‑hour pivot downside level. If gold price holds above it, a bounce is likely. A break below targets $4,100 and lower.
Where should I set a stop loss if I go long?
A stop below $4,150 offers approximately one ATR of buffer and protects against stop runs common in the Asian session. Adjust lot sizes so the dollar risk aligns with your account plan.
Trading Gold (XAU/USD) carries significant risk of loss and is not suitable for all investors. This content is for informational purposes only and does not constitute financial advice. Always conduct your own research and trade responsibly.