
The gold price opened the European session at $4,529.26, hovering just above the short-term moving average but well below the medium-term trend. With volatility picking up as London desks activate, traders are eyeing two critical pivot levels: the $4,559 resistance from the one-hour chart and the $4,519 downside target on the same timeframe. Despite muted cross movements in FX pairs like GBP/JPY, gold is drawing attention as technical forces converge. This session could determine whether momentum accelerates toward the daily upside target of $4,838 or pulls back to retest the $4,667 support zone. Let’s break down the key levels and what to watch in the hours ahead.
Gold Price Forecast – European Session Outlook
Macro Context
The US Dollar Index continues to slide toward the 99.00 handle, providing underlying support for the gold price. Lower Treasury yields, driven by expectations that the Federal Reserve may cut rates sooner than previously anticipated, are adding further tailwinds. Geopolitical tension in Eastern Europe remains a background risk, though its direct impact on gold flows has been muted this week. Yesterday’s data showing slowing US housing starts reinforced the narrative of a cooling economy, which historically benefits precious metals.
Session Outlook
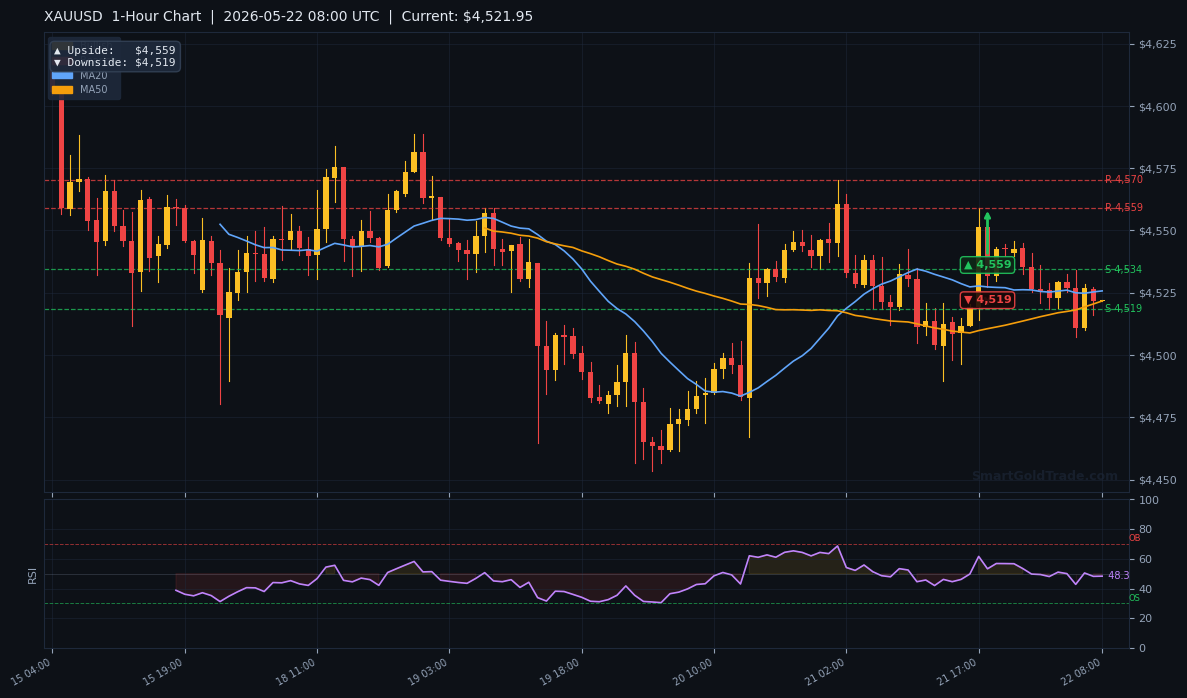
The European session typically sees higher liquidity than the Asian session, and today is no exception. Expect the $4,519–$4,559 range to be tested early. Any break beyond these levels could trigger a sharper move. Watch for the release of US weekly jobless claims at 12:30 UTC; a surprise above consensus could push the gold price through $4,559 resistance, while a lower print may strengthen the dollar and pressure gold back toward the $4,519 support.
Technical Analysis
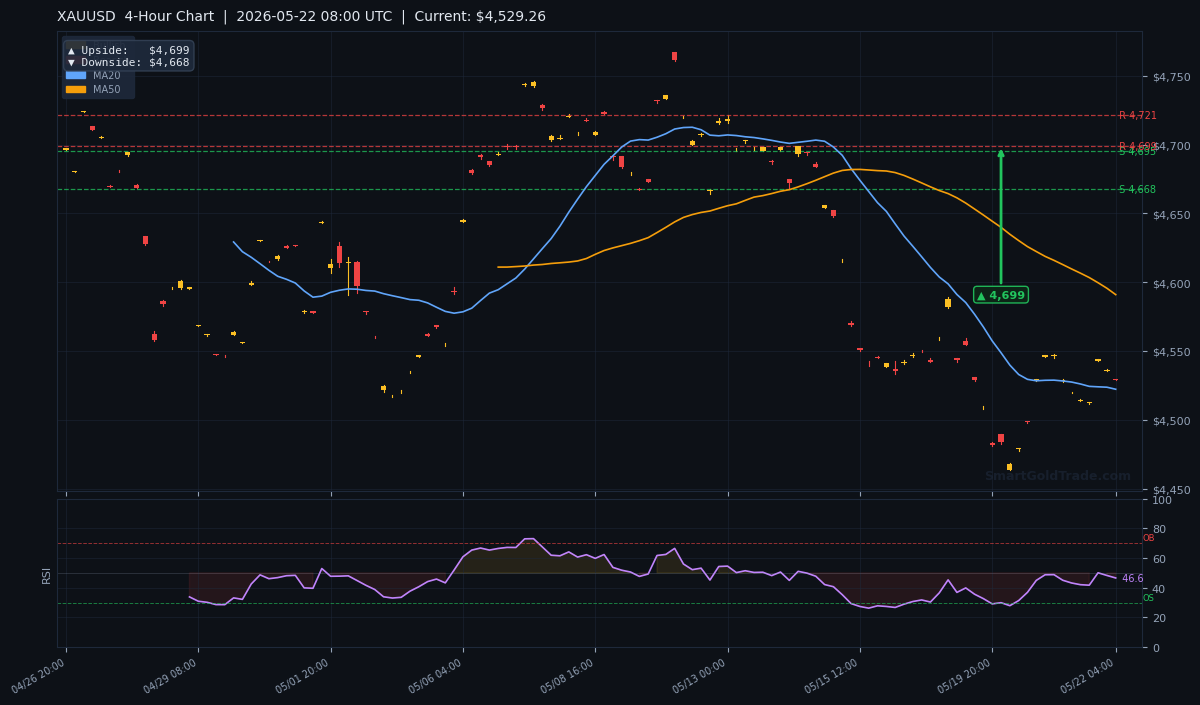
The technical picture on the 4-hour timeframe reveals a market caught between conflicting moving averages. The MA20 sits at $4,522.19, just below the current price—short-term bullish. However, the MA50 at $4,590.96 and the MA200 at $4,677.61 are both above, confirming a bearish medium- to long-term structure. The RSI(14) at 46.6 sits in neutral territory, giving no clear directional bias. The ATR(14) of $14.11 implies an expected daily range of about $14, meaning the gold price could easily oscillate between $4,515 and $4,543 in normal conditions.
Moving Average Structure
The ordering of MA20 below MA50 below MA200 is a classic short-term bearish pressure signal. While the gold price has pushed above the MA20, it remains well below the other two. For a true trend reversal, buyers would need to reclaim the MA50 at $4,590.96 and eventually the MA200 at $4,677.61.
RSI and Momentum
The RSI(14) reading of 46.6 indicates neutral momentum with a slight bearish lean (since it is below 50). This is consistent with the price action—gold is not oversold enough to attract dip buyers, nor overbought enough to cause a snap reversal. Momentum oscillators like the MACD are showing a flattening histogram, suggesting a period of consolidation before the next move.
Key Price Levels
From the indicator data, the official daily support levels are S1: $4,695.39 and S2: $4,667.98, though these are above the current price—these represent resistance on the daily chart. The pivot arrows on the charts provide more actionable short-term levels:
| Timeframe | Upside Target | Downside Target |
|---|---|---|
| 1-Hour | $4,559 | $4,519 |
| 4-Hour | $4,699 | $4,668 |
| Daily | $4,838 | $4,667 |
The 1-hour chart is the focal point for today’s trading. A break above $4,559 would open the path toward the 4-hour resistance at $4,699. Conversely, a loss of $4,519 could trigger a decline toward the $4,468 area (the next psychological level).
Fundamental Drivers
News flow is relatively light this morning. The British Pound is trading flat against the Japanese Yen near 213.70, indicating that FX markets are taking a breather. This lack of directional cues from major currency pairs leaves the gold price to trade on its own technical merit and broader macro sentiment.
Key Event to Watch
The US weekly jobless claims report at 12:30 UTC remains the top event risk for this session. A print below 220,000 would suggest continued labour market tightness, potentially strengthening the dollar and weighing on gold. A figure above 240,000 would confirm a softening trend and could propel the gold price through $4,559. Additionally, ongoing geopolitical concerns keep a floor under the market—many investors continue to seek a store of value through physical gold products as a hedge against uncertainty.
Devil’s Advocate
The main bullish bias could be invalidated if the gold price fails to hold above the $4,519 support. A daily close below this level would likely trigger stop-losses and accelerate selling toward the next key zone at $4,468. Furthermore, if the US Dollar Index reverses its recent decline and pushes back above 100.00, gold would lose its primary macro tailwind. In that scenario, the MA20 at $4,522.19 would become resistance rather than support.
Trading Strategy for European Session
Given the neutral RSI and the clear pivot levels, a range-trading approach is appropriate. Consider the following setup:
- Entry zone: $4,525–$4,535 (near current price and above MA20 support)
- Stop loss: Below $4,515 (approximately 1 ATR below entry)
- Take profit 1: $4,559 (1-hour resistance)
- Take profit 2: $4,580 (next psychological level)
For those who prefer professional guidance, consider following real-time trading alerts from experienced analysts. A break above $4,559 would shift the bias to aggressive bullish, targeting $4,699 next. Conversely, a break below $4,519 signals bearish continuation; in that case, sell the break with a stop above $4,525 and target $4,468.
Key Takeaways
- The gold price at $4,529.26 is trading above the MA20 ($4,522.19) but below the MA50 ($4,590.96), creating a tug-of-war.
- RSI(14) at 46.6 suggests room for movement in either direction.
- The 1-hour pivot levels are $4,559 (upside) and $4,519 (downside) – these define today’s range.
- A break above $4,559 points to a rally toward $4,699 (4-hour resistance).
- A break below $4,519 risks a decline to $4,468 and eventually the daily target of $4,667.
- Expected volatility: $14.11 per the ATR(14), supporting tight stop management.
Conclusion
The gold price is at a decision point in the European session. With the MA20 providing near-term support and the MA50 looming overhead, traders should focus on the $4,559–$4,519 bracket. A catalyst from US jobless claims could tip the balance. Until then, expect ranging behavior with a slight bullish lean as long as the $4,519 level holds. Stay disciplined, use the ATR to calculate risk, and let the price tell you which direction to trade.
Frequently Asked Questions
- What is the current gold price?
- The gold price in the European session on May 22, 2026 is $4,529.26 per troy ounce.
- What are the key resistance levels for gold today?
- Immediate resistance is at $4,559 (1-hour pivot), followed by $4,699 (4-hour pivot) and $4,838 (daily upside target).
- What support levels should I watch for a potential breakdown?
- The first support is $4,519 (1-hour downside target). Below that, $4,468 and the daily support at $4,667 come into play.
- How does the US Dollar Index affect the gold price?
- A weaker DXY (currently near 99.00) typically boosts gold prices because it makes the dollar-denominated metal cheaper for foreign buyers. A DXY rally above 100 would be negative for gold.
- Is gold a good hedge against inflation right now?
- Given the Federal Reserve’s potential pivot to rate cuts and cooling economic data, gold is regaining its appeal as an inflation and uncertainty hedge. Many investors are diversifying into physical gold products as a long-term store of value.
Trading Gold (XAU/USD) carries significant risk of loss and is not suitable for all investors. This content is for informational purposes only and does not constitute financial advice. Always conduct your own research and trade responsibly.