
The gold price is consolidating just below the $4,808 level as the American session begins, presenting a clear moment of decision for traders. Last week's economic data, including a stronger-than-expected Danish consumption report, fed into a broader narrative of cautious economic resilience in Europe. The market's reaction was muted, leaving gold to trade on its own technical merits ahead of the New York open. This session will determine if the recent bullish momentum has the strength to challenge significant overhead resistance, or if a retracement to firmer support is needed first.
Following a steady climb from the Asian and European sessions, XAUUSD finds itself in a tactical standoff. The price action is compressed between a key cluster of moving averages and the formidable 200-day average overhead. For directional conviction, traders will look to the liquidity and volatility typical of New York hours to force a breakout. The immediate question is whether bulls can muster the volume to stage a second assault on the $4,857 level, or if profit-taking will send the metal back toward the $4,730 support zone.
Gold Market Overview
Macro Context
The broader macro environment remains a mix of supportive and restrictive factors for gold. The US Dollar Index (DXY) continues to wield significant influence, with any unexpected strength acting as a headwind for dollar-denominated bullion. US Treasury yields, a key driver of the opportunity cost of holding non-yielding gold, are in focus as the market digests the Federal Reserve's current pause-and-hold posture. While no immediate rate cuts are priced in, the Fed's data-dependent stance keeps traders on edge. Geopolitical tensions, while simmering, have not escalated to a level that would trigger a classic safe-haven surge, leaving gold's path more closely tied to traditional financial market flows and technical dynamics.
Session Outlook
The American session, with its deep liquidity and high participation from institutional desks, is where the next significant move is likely to be forged. Expect volatility to pick up as New York traders engage, with the Average True Range (ATR) suggesting a potential daily range near $24.60. The primary trigger will be price action around the identified technical levels rather than scheduled news, though any unscheduled geopolitical or central bank commentary could inject sudden momentum. The battle line is drawn between the $4,730 support and the $4,857 resistance; a sustained break of either will set the tone for the coming days.
Technical Analysis
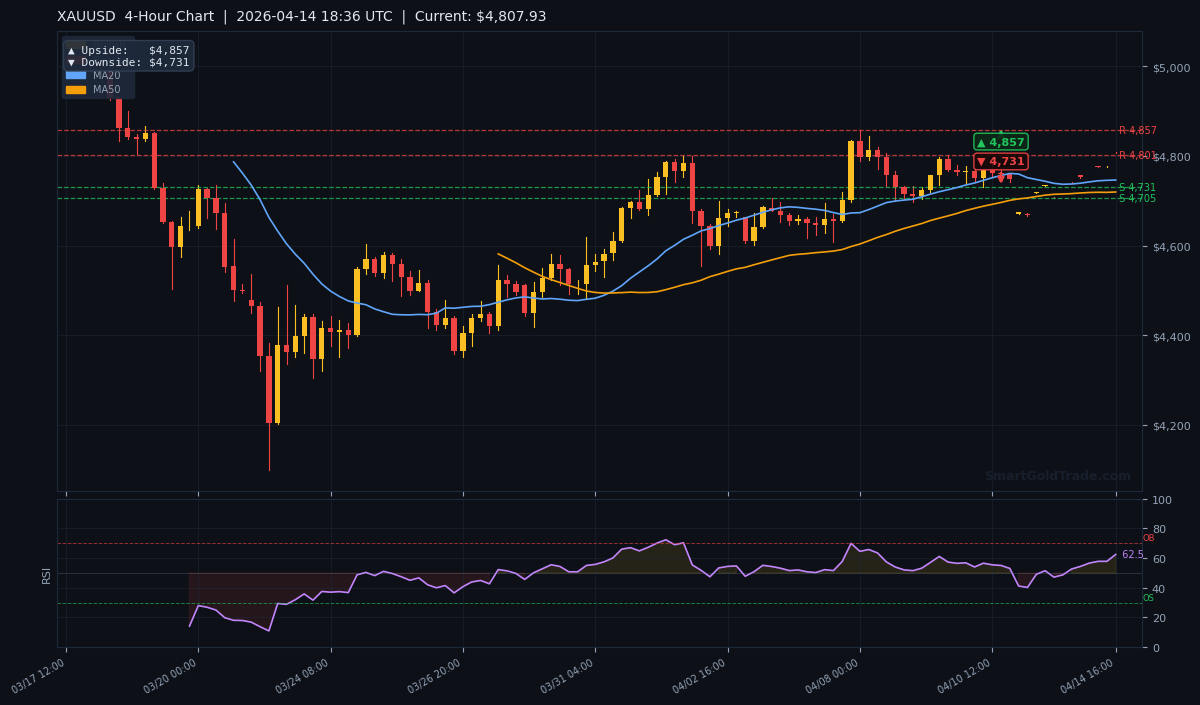
The technical picture presents a short-term bullish structure fighting against a significant long-term hurdle. The current price of $4,807.93 is positioned above both the short and medium-term moving averages, signaling underlying buying pressure. However, its position below the primary long-term average suggests the broader trend is not yet decisively bullish. The Relative Strength Index (RSI) reading of 62.5 sits in a neutral zone, indicating there is room for the price to move in either direction before becoming overbought or oversold. This creates a balanced environment where breakout moves can gain momentum.
Moving Average Structure
The moving averages provide a clear map of the trend structure. The price sits above the MA20 at $4,746.23 and the MA50 at $4,719.48, confirming a bullish short to medium-term bias. Crucially, the MA20 is above the MA50, reinforcing this positive momentum. The major obstacle is the MA200 at $4,846.09, which the price currently trades below. A sustained break and close above this level would be a powerful signal of a potential long-term trend reversal from bearish to bullish.
RSI and Momentum
The RSI(14) at 62.5 is informative for trade timing. It is not in overbought territory (>70), which suggests the recent upward move is not yet exhausted and could have further to run. However, it is also far from oversold (<30), meaning any pullback would likely be a corrective move within an uptrend rather than a deep reversal. For traders, this RSI level suggests looking for bullish continuation entries on minor dips toward support, or waiting for a break above resistance with RSI confirmation for a momentum play.
Key Price Levels
Support and resistance levels derived from recent price action are critical for framing risk. Immediate support lies at S1: $4,730.58, with a stronger floor at S2: $4,705.44. On the upside, the first target for bulls is R1: $4,857.30, which aligns perfectly with the 200-day MA. Beyond that, R2 at $4,801.26 may act as minor resistance. The ATR(14) of $24.60 gives us a statistical expectation for today's potential high-to-low range, helping to set realistic stop-loss and take-profit distances.
| Timeframe | Upside Target | Downside Target |
|---|---|---|
| Daily | $5,250 | $5,014 |
| 4-Hour | $4,857 | $4,731 |
| 1-Hour | $4,735 | $4,744 |
Fundamental Drivers
The primary fundamental data point from the source material, a stronger Danish private consumption report for March, has already been absorbed by the market. While indicative of regional economic health, its direct impact on global gold prices is limited. The more dominant fundamental forces remain the US Dollar's trajectory and real yields. A softer dollar directly supports a higher gold price, while falling real yields decrease the opportunity cost of holding the metal. Current Fed expectations are in a holding pattern, but any shift in rhetoric toward a more dovish stance would be a potent catalyst for a gold rally. Geopolitical risk remains a constant, underlying bid for gold, though it is not the primary driver at this moment.
Key Event to Watch
This week, traders will watch for any commentary from Federal Reserve officials for clues on the timing of potential policy shifts. While major data like CPI and PPI are behind us, speeches from voting members can still cause ripples. The most significant impact would come from any suggestion that recent economic strength is wavering, potentially bringing forward expectations for rate cuts. Such a development would likely weaken the dollar and boost gold's appeal as a non-yielding asset, providing the fundamental fuel needed for a technical breakout above the $4,857 resistance. For those interested in long-term, hands-off strategies to capitalize on such macro shifts, our Islamic partnership investment pools offer a structured, Shariah-compliant approach.
Devil's Advocate
The bullish short-term setup is compelling, but it is not without risks. The most immediate threat is a failure to breach the $4,857 resistance, which could trigger a wave of profit-taking from bulls who entered at lower levels. A more significant reversal would be confirmed if the price breaks down and sustains below the key $4,730 support area. Such a move would likely see a test of the MA50 near $4,719. This scenario would be activated by a sudden spike in the US Dollar or a hawkish surprise from a Fed speaker, shifting market expectations toward 'higher for longer' interest rates and pressuring gold.
Trading Strategy for American Session
Given the technical confluence, a two-pronged strategy offers defined risk. The primary bias is cautiously bullish, looking for a break above consolidation. A confirmed breakout above $4,820 (a minor intraday high) could target a move toward R1 at $4,857. An entry on such a breakout should be protected with a stop loss below the recent swing low, around $4,785, representing just over 1x the ATR. The alternative, more conservative approach is to wait for a pullback to the support zone between $4,730 and $4,745 (near the MA20) for a long entry, targeting a return to the $4,807–$4,820 area initially. For traders who prefer to follow expert execution rather than analyze every entry, our copy trading platform mirrors the live trades of our top-performing analysts.
For the bearish invalidation scenario, a break and close below $4,730 would signal a shift. A short entry on a retest of that broken support as new resistance, with a stop above $4,750, could target a move down to $4,705 (S2). Regardless of direction, using the ATR value of $24.60 to guide stop-loss placement ensures risk is proportionate to current market volatility. For traders who use automated systems, managing risk during volatile sessions is crucial; tools like a news event trading protection bot can automatically pause strategies during high-impact announcements.
Key Takeaways
- The gold price at $4,807.93 is in a short-term bullish structure but faces a major test at the 200-day MA ($4,846.09).
- Key intraday resistance is R1 at $4,857.30, while major support sits at S1: $4,730.58.
- The RSI at 62.5 is neutral, indicating room for the price to move higher before being overbought.
- A breakout above $4,857 could open the path toward the daily chart target of $5,250.
- A break below $4,730 support would invalidate the immediate bullish bias and target $4,705.
- Expected daily volatility, based on the ATR, is approximately $24.60.
Conclusion
The stage is set for a decisive move in the gold price during the American session. The technical alignment favors the bulls in the near term, with price holding above key moving averages and momentum not yet overextended. However, the proximity to the formidable $4,857 resistance and the 200-day MA demands respect. Traders should watch for a clear breakout above this zone with increasing volume as a signal for continuation. Conversely, a rejection here could lead to a healthy retracement toward the $4,730 support, offering a potential better risk-reward entry for the next leg higher. The balance of probabilities tilts toward eventual upside, but the path is likely to be contested.
Frequently Asked Questions
- What is the most important level for gold right now?
- The confluence of resistance at $4,857 (R1) and the 200-day moving average at $4,846 is the key ceiling. A break above is needed for a sustained bullish move.
- Is gold overbought at current levels?
- No. With an RSI of 62.5, gold is not in overbought territory (>70). There is technical room for the price to advance further before a correction becomes highly likely on that metric alone.
- Where should I place a stop loss if I go long?
- For a long trade targeting a breakout, a stop below $4,785 is logical. For a long entry on a pullback, a stop below the key $4,730 support zone is essential to manage risk.
- What is a realistic profit target for today's session?
- Based on the ATR and resistance levels, a move from current prices to the $4,857 area is a realistic bullish target. On the downside, a move to $4,730 is the first key target if support breaks.
Trading Gold (XAU/USD) carries significant risk of loss and is not suitable for all investors. This content is for informational purposes only and does not constitute financial advice. Always conduct your own research and trade responsibly.