Gold price surged earlier this week after softer US inflation figures rattled the dollar, pushing XAUUSD toward $4,164. But the momentum has evaporated. By the American session on July 15, 2026, gold is slipping back to $4,046.35, dangerously close to the $4,043 downside pivot. Traders who chased the CPI spike are now questioning whether this is a deeper correction or just a shakeout before the next leg higher. The next few hours will decide. With US retail sales data looming, the American session is poised to deliver a sharp directional move.
Gold Market Overview
Macro Context
Last week's US Consumer Price Index report landed below consensus, briefly knocking the US Dollar Index off its pedestal and fuelling a risk-on bid for bullion. The 10-year Treasury yield dipped toward 3.80%, reinforcing the initial gold price rally. However, hawkish Fed rhetoric on Monday reminded markets that a single soft inflation print does not guarantee a near-term rate cut. The dollar has since clawed back ground, and gold's failure to hold above the $4,147.61 support-turned-resistance zone underscores the fragility of the bullish case. Geopolitical noise from Eastern Europe and simmering US-China tech tensions adds a mild safe-haven bid, but macro flows are currently dominated by yield differentials and positioning ahead of Thursday's retail sales.
Session Outlook
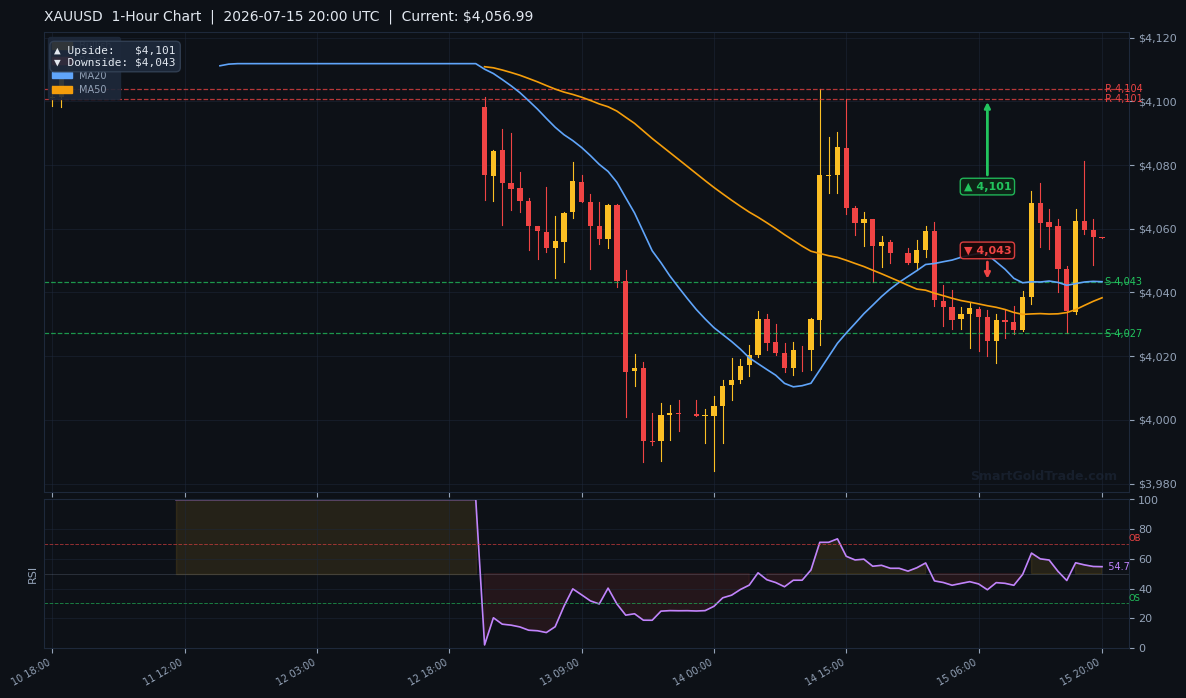
The American session is entering its peak liquidity window. New York desks will square positions after the European close, and any headline related to US consumption or Fed speak could trigger a volatility spike. The ATR(14) reading of $15.02 suggests an intraday range of roughly $4,031 to $4,061, with the lower bound aligning closely with the $4,043 pivot. I expect sellers to probe this level early, using any bounce toward the $4,049.33 20-period moving average as a re-entry point. A break below $4,043 on rising volume would open the door to a rapid move toward the daily downside target of $4,076.
Technical Analysis
Moving Average Structure
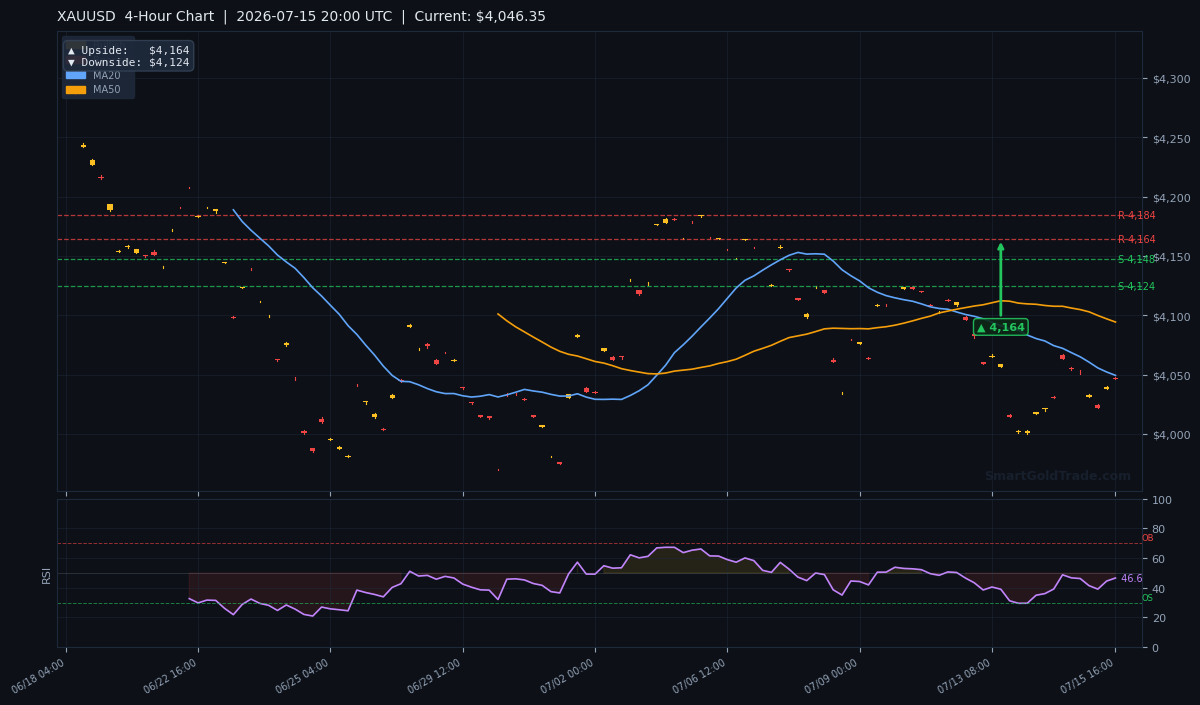
The MA20 stands at $4,049.33, and with the spot price at $4,046.35, the metal is trading below this short-term gauge — a clear bearish signal on the H4 timeframe. The MA50 at $4,094.25 and the MA200 at $4,190.68 both loom far above, confirming that the intermediate and long-term trends are tilted lower. The MA20 having crossed below the MA50 earlier this month reinforces the negative alignment. For bulls to regain control, they must first reclaim $4,049 and then mount an assault on the $4,094 area. Until that happens, rallies are likely to be sold.
RSI and Momentum
The 14-period RSI reads 46.6, smack in the middle of neutral territory but with a downward bias. This is not yet oversold, meaning there is still room for the gold price to fall before bargain hunters step in. Momentum oscillators on the H1 chart are printing lower highs, consistent with a staircase decline. A drop below the 40 level on the RSI would confirm accelerating downside pressure and likely coincide with a breach of the $4,043 floor.
Key Price Levels
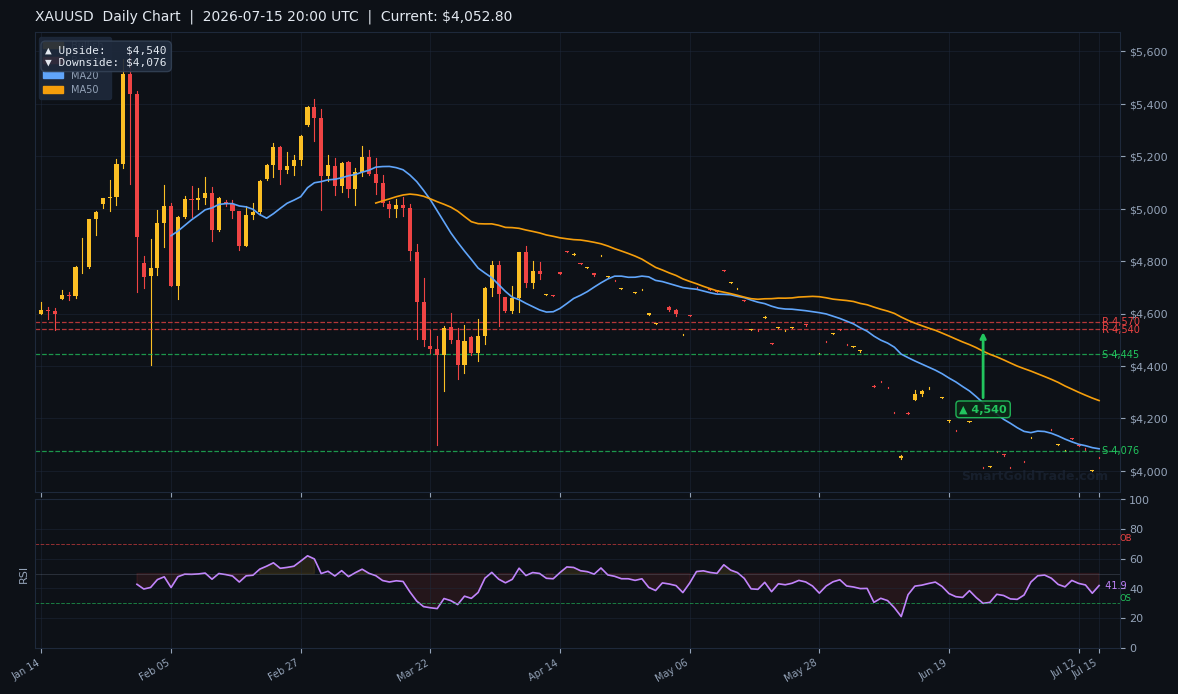
With the current quote well below both $4,164.51 (S1) and $4,147.61 (S2), those former supports now act as resistance. A sustained move above S2 is required to even begin repairing the short-term damage. On the upside, $4,184.32 (R1) and $4,181.55 (R2) represent formidable barriers that align with the H4 chart's bearish structure. The pivot arrows on the 1-hour timeframe point to an immediate downside target of $4,043, while the 4-hour chart extends that target to $4,124 if the break gathers momentum. The daily pivot downside sits at $4,076, providing a medium-term magnet for any extended sell-off.
Fundamental Drivers
The softer US CPI print last week was the catalyst that briefly lifted gold price above $4,100. However, the rally stalled precisely at the $4,164 resistance, and the subsequent rejection suggests that large players used the spike to distribute long positions. Fed Governor Waller's comments on Monday underscored that one data point does not a trend make, keeping rate-cut expectations in check. The US Dollar Index has since stabilised near 101.50, eroding gold's attractiveness. While safe-haven demand from geopolitical risks provides a soft floor, the dominant theme this week is the tug-of-war between receding inflation optimism and a still-hawkish Fed.
Key Event to Watch
Thursday's US retail sales report for June is the next major volatility catalyst. A robust consumer spending number would reinforce the 'higher for longer' rate narrative, likely pushing the dollar higher and gold below $4,043. Conversely, a sharp miss could revive the soft-landing trade and trigger a short squeeze toward $4,094. For this American session, any headlines previewing that data or Fed whispers will move the needle quickly. Traders should also monitor the 10-year auction results for demand signals — strong demand supports lower yields and could temporarily lift bullion.
Devil's Advocate
The bearish thesis collapses if gold price finds aggressive buying at the $4,043 pivot and prints a swift rebound back above the $4,049.33 MA20. A reclaim of that level would trap late shorts and could fuel a rapid squeeze toward the $4,124 4-hour target. This scenario gains traction if US economic data surprises to the downside or if a geopolitical shock triggers a flight to safety. The key invalidation point for any downside trade is an hourly close above $4,067 — the approximate high of the European session. Should that level break, the intraday trend flips neutral and the focus shifts to a range between $4,067 and $4,094.
Trading Strategy for American Session
I am watching the $4,043 level like a hawk. A confirmed breakdown — ideally on a 15-minute close below that figure with rising volume — triggers a sell entry. I would place a stop-loss at $4,067, just above the MA20 and the session's high, keeping risk within a $24 range, which is roughly 1.6 times the ATR. The first take-profit target sits at $4,024, a round number that aligns with projected support from the 1-hour chart. A more aggressive runner can be set to $4,010, offering a risk-reward ratio of nearly 1:2. This setup respects the bearish moving-average structure and the momentum profile.
For traders seeking riba-free execution of such spot-based strategies, halal gold trading on SmartGoldTrade delivers physical ownership without leverage or overnight fees. Deeper insight into calculating levels like these can be found in our guide on gold pivot points. Real-time alerts during high-impact events are available through professional gold trading signals.
Key Takeaways
- Gold price is trading at $4,046.35, below the MA20 of $4,049.33 and all major moving averages — a bearish structure.
- The $4,043 1-hour downside pivot is the make-or-break level for the American session.
- Support levels S1 ($4,164.51) and S2 ($4,147.61) have flipped to resistance; bulls need a close above $4,147.61 to shift sentiment.
- RSI at 46.6 leaves downside room before reaching oversold, suggesting selling pressure can continue.
- ATR of $15.02 implies an expected intraday range of $4,031 – $4,061, framing stop placement and targets.
- Thursday's US retail sales report is the next major catalyst; a strong print could accelerate the decline toward the daily pivot at $4,076.
Conclusion
The post-CPI euphoria has faded, and the gold price now faces a critical test at $4,043. Sellers have the momentum, backed by a bearish moving-average stack and a neutral-but-weakening RSI. A clean break below this pivot would expose the $4,024 and eventually $4,010 zones, while a bounce and reclaim of $4,049 could squeeze shorts toward $4,094. The American session will be driven by positioning ahead of retail sales, and volatility is almost guaranteed. I lean bearish as long as we stay below $4,049, but I'll respect a quick reversal above $4,067. Stay nimble, trade the levels, and let the data confirm the move.
Frequently Asked Questions
- Why did gold price jump after the US CPI report?
- The softer inflation data weakened the US dollar and lowered the opportunity cost of holding non-yielding assets like gold. The gold price briefly surged to test the $4,164 resistance before profit-taking set in.
- What is the most important level for gold today?
- The $4,043 downside pivot on the 1-hour chart is the session's linchpin. A breakdown below it could send the metal toward $4,024, while a hold above keeps the range between $4,043 and $4,067 alive.
- How should I set my stop loss if I short gold now?
- Using the ATR of $15.02, a stop above $4,067 — above the MA20 and session high — provides a reasonable buffer. This keeps risk tight while respecting the bearish structure down to $4,024.
- Can the Fed reverse gold's bearish trend this week?
- Only if Fed speakers signal an imminent rate cut or Thursday's retail sales miss badly. In that scenario, gold could reclaim $4,094 and challenge the $4,181 resistance zone. Until then, the path of least resistance is lower.
Risk Disclaimer: Trading Gold (XAU/USD) carries significant risk of loss and is not suitable for all investors. This content is for informational purposes only and does not constitute financial advice. Always conduct your own research and trade responsibly.