
The gold price currently trades at $4,683.49 in the Asian session, caught in a quiet zone between short-term resistance and medium-term support. Last week's Fed decision to hold rates steady has left the dollar directionless, allowing gold to consolidate. For today, patience is prudent — thin liquidity demands a measured approach.
Gold Price Market Overview
Macro Context
The US Dollar Index (DXY) remains soft after last week's Fed meeting, which reaffirmed a cautious stance on rate cuts. Treasury yields are flat, with the 10-year hovering near 4.32%. Geopolitical risks linger but lack fresh catalysts. The macro backdrop offers no strong directional bias for the gold price, keeping traders focused on technical levels.
Session Outlook
Asian session liquidity is typically thin, and today is no exception. Expect the gold price to oscillate within a $15–20 range until European open. Key triggers are absent, so range-bound behaviour is likely. Avoid chasing moves — false breaks are common in low volume.
Technical Analysis
Moving Average Structure
The MA20 (short) sits at $4,698.24, while the MA50 (medium) is at $4,626.56. The gold price is below the MA20 but above the MA50, creating a mixed signal. The MA200 (long) at $4,674.46 confirms the bull market is intact — price is above this key trend filter. Note that the EMA structure shows MA20 > MA50, indicating short-term bullish momentum remains in the rearview mirror, but the spot price must reclaim the MA20 to reignite urgency.
RSI and Momentum
The RSI(14) stands at 51.9, squarely neutral. Neither overbought nor oversold, the oscillator gives no clear edge. Momentum is flat — we need a push above 55 or below 45 to confirm a directional shift.
Key Price Levels
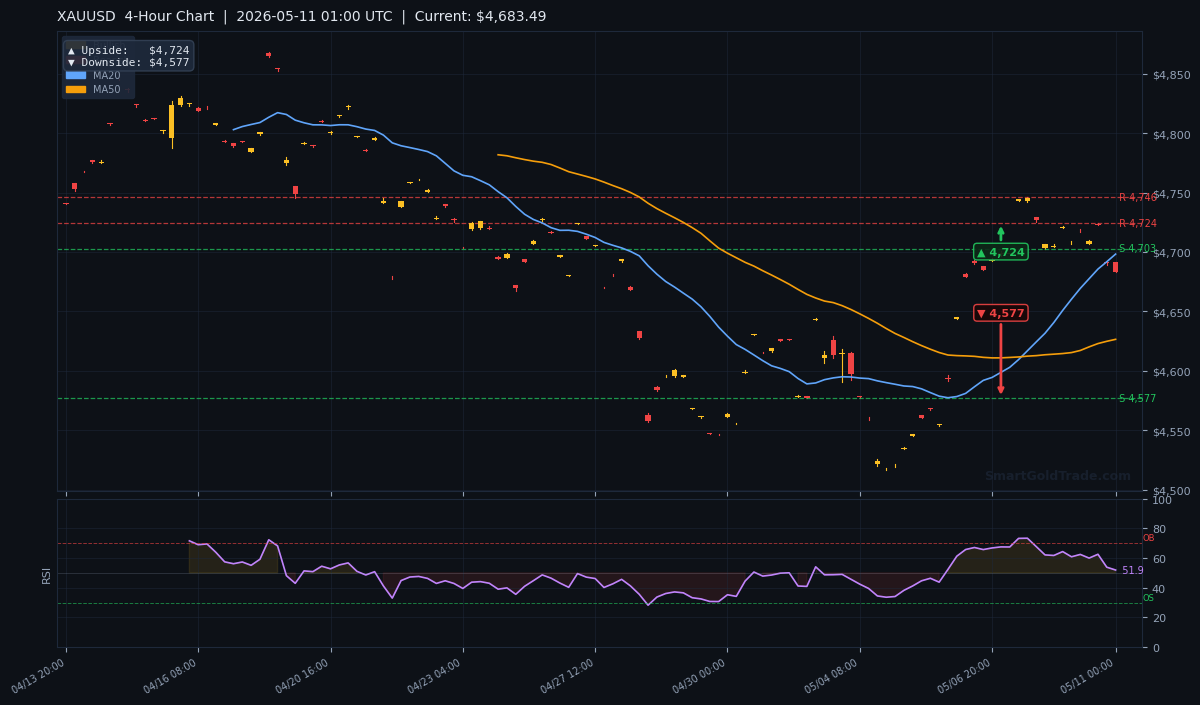
Based on live data, support levels are S1: $4,702.94 (watch for flip – currently above price) and S2: $4,577.37. Resistance stands at R1: $4,745.97 and R2: $4,724.42. The ATR(14) of $15.48 suggests a typical daily range of about $31, so expect the gold price to stay within the $4,667–$4,724 zone today.
| Timeframe | Upside Target | Downside Target |
|---|---|---|
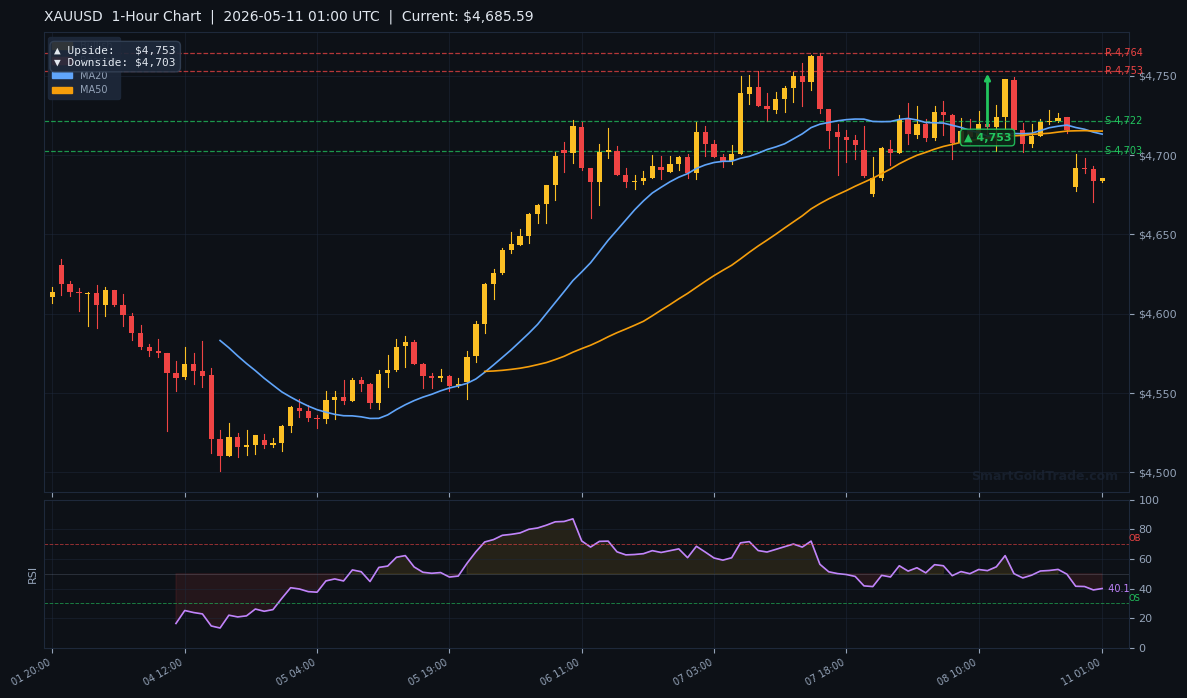
| 1-Hour | $4,753 | $4,703 |
| 4-Hour | $4,724 | $4,577 |
| Daily | $4,857 | $4,667 |
Fundamental Drivers
The only notable macro input this week is the US PPI report scheduled for Wednesday. If producer prices come in hot, the dollar could strengthen and pressure gold. Conversely, a soft print would reinforce the case for Fed cuts, supporting the gold price. For now, the market is pricing in a 60% chance of a September rate cut.
Key Event to Watch
Wednesday’s US Producer Price Index is the single most important event this week. A miss could trigger a breakout above $4,724; a beat may drag the gold price toward $4,667. Trade carefully around the release.
Devil’s Advocate
The main risk to the current setup is a sudden dollar rally. If DXY breaks above 102.50, gold could slide below the MA200 at $4,674.46, invalidating the bullish frame. A daily close under $4,667 would flip the bias to bearish, targeting the next support at $4,577.
Trading Strategy for Asian Session
For patient traders, consider buying the gold price in the $4,670–$4,680 zone with a stop loss at $4,660 (below the MA200). Initial take profit at $4,703 (1-hour resistance) and secondary target at $4,724 (4-hour resistance). Risk-reward ratio is approximately 1:3 if the full move materialises. Alternatively, if the price breaks above $4,703 with volume, a continuation play toward $4,724 becomes viable. This strategy aligns with the gold price setup for the Asian session.
Key Takeaways
- The gold price is $4,683.49, below MA20 but above MA200.
- Neutral RSI of 51.9 favours a range-bound strategy.
- Key resistance: $4,724 (4-hour upside target).
- Key support: $4,667 (daily downside target).
- ATR of $15.48 suggests a ~$31 daily range.
- US PPI on Wednesday is the next major catalyst.
Conclusion
The gold price offers a clear opportunity today: a defined entry zone near $4,675, stop below the MA200, and a target at $4,724. Low Asian session volume requires discipline — wait for the price to come to you. With the Fed on hold and PPI ahead, the market is building energy for the next move. Stay patient, respect the levels, and trade responsibly.
Frequently Asked Questions
- What is the current gold price?
- As of May 11, 2026, Asian session, the gold price stands at $4,683.49 per troy ounce.
- What are the key resistance levels for gold today?
- Resistance sits at $4,724 (4-hour pivot) and $4,753 (1-hour pivot), with the major barrier at $4,857 on the daily chart.
- What support levels should I watch for gold?
- Immediate support is $4,667 (daily downside target), followed by $4,577 (4-hour downside pivot) and $4,574 (MA200).
- How can I trade gold without interest?
- For Shariah-compliant trading, you can use a halal gold trading platform that offers physical ownership and no leverage, ensuring compliance with Islamic finance principles.
- What is the most important economic event this week for gold?
- The US Producer Price Index report on Wednesday is the key event. A deviation from expectations could drive the gold price beyond the current range.
- Where can I get real-time gold trading signals?
- Professional gold trading signals provide entry, stop-loss, and take-profit levels analysed by experts, delivered via Telegram.
Trading Gold (XAU/USD) carries significant risk of loss and is not suitable for all investors. This content is for informational purposes only and does not constitute financial advice. Always conduct your own research and trade responsibly.