
Gold opened the week at $4,715.45 per troy ounce, and this gold price forecast next week (May 10–16, 2026) outlines what could drive XAU/USD in the coming days. Extending gains from the prior session, geopolitical tensions in the Hormuz Strait and a weakening US Dollar continue to support safe-haven inflows. Last week, XAU/USD recovered sharply from a $4,467 low after a brief liquidity flush, closing above $4,700 for the first time in May.
Last Week in Review
Price Action Recap
The trading week of May 4–8 saw gold swing violently as markets digested a central bank bonanza and escalating US‑Iran rhetoric. Monday opened near $4,600 after Friday's payroll shock, but a sharp dollar selloff pushed prices to a weekly high of $4,760 by Wednesday. Profit‑taking and margin‑call‑driven selling on Thursday triggered a $250 plunge to $4,467, before buyers stepped in at the 200‑day moving average. By Friday's close, gold had recovered to $4,722, leaving a long lower wick on the weekly candle.
Key Events That Moved Gold
Last week's FOMC decision delivered no rate change but a noticeably dovish statement, acknowledging softening labor data. That sent the DXY below 99.50 for the first time since January, providing a tailwind for gold. Meanwhile, US‑Iran tensions escalated after a reported naval incident near the Strait of Hormuz, triggering a brief bid for safe havens. The US ISM Services PMI came in at 49.8, a contraction reading that reinforced recession fears and further weakened the dollar.
Weekly Close Analysis
The weekly candle printed a hammer with a lower shadow nearly 5% of the body, a classic bullish reversal pattern after a selloff. Price closed above both the 20‑ and 200‑day MAs, confirming that the structural uptrend remains intact. The close at $4,722 places gold back inside the multi‑week consolidation zone between $4,670 and $4,760, setting the stage for a breakout test this week.
Next Week Economic Calendar & Gold Impact
This week’s data flow is dominated by US inflation and retail sales figures, alongside the release of the Fed’s May meeting minutes. Each release has the potential to either confirm or challenge the current market narrative of a weakening US economy and a dovish Fed pivot.
| Day | Event | Forecast | Previous | Gold Impact |
|---|---|---|---|---|
| Mon May 11 | No major US data | – | – | Low impact; likely technical trading |
| Tue May 12 | US CPI (YoY) Apr | 3.1% | 3.0% | If above 3.1% → hawkish, gold may dip to $4,670; if below 3.0% → dovish, gold tests $4,746 |
| Wed May 13 | FOMC Minutes (May meeting) | – | – | Dovish tone supports gold; any hawkish surprise could push price below $4,703 |
| Thu May 14 | US Retail Sales (MoM) Apr | 0.4% | 0.2% | Weak retail sales → recession fears lift gold; strong sales → temporary dollar strength, gold may test $4,667 |
| Fri May 15 | US PPI (YoY) May | 2.8% | 2.6% | Above forecast hawkish → gold downside; below forecast dovish → upside towards $4,857 |
Technical Analysis
Moving Average Structure
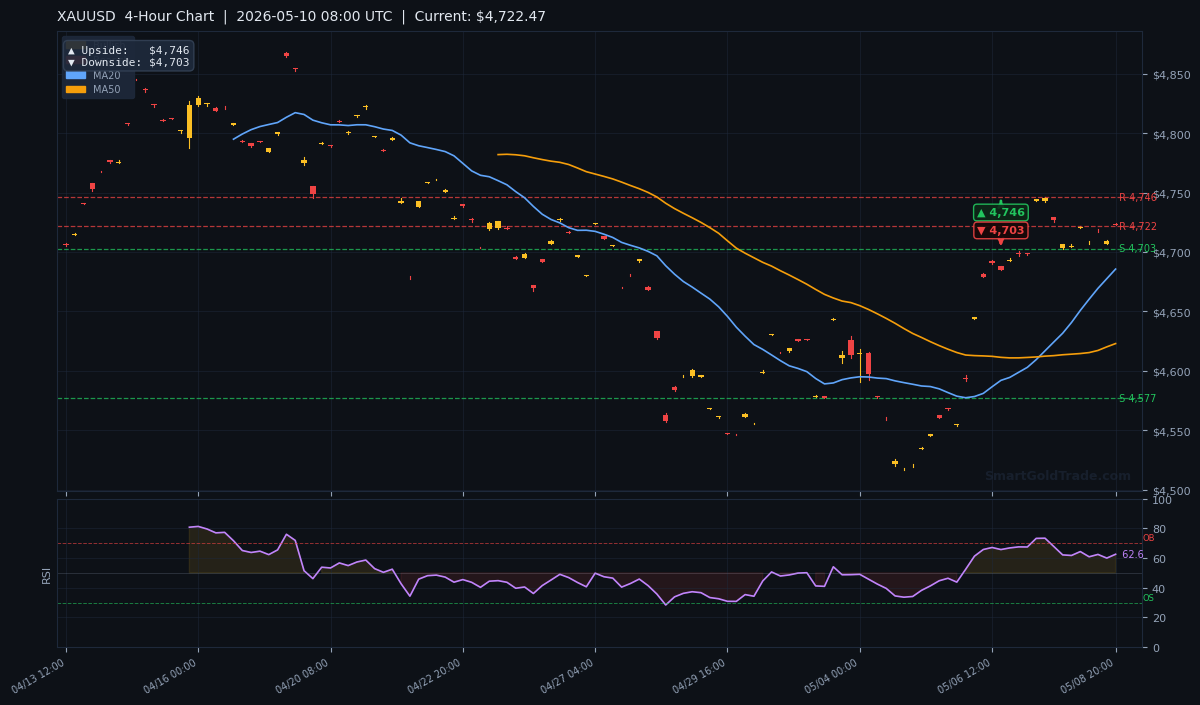
On the 4‑hour chart, price is trading at $4,722.47, comfortably above the MA20 ($4,685.64), MA50 ($4,623.00), and MA200 ($4,672.32). The MA20 is above the MA50, confirming short‑term bullish momentum. The entire MA stack is bullish, indicating that dips are likely to be bought.
RSI and Momentum
The 14‑period RSI stands at 62.5, squarely in neutral territory. This leaves room for further upside before reaching overbought conditions above 70, while a drop below 50 would signal a bearish shift. Momentum oscillators are flat, suggesting the market is awaiting a catalyst.
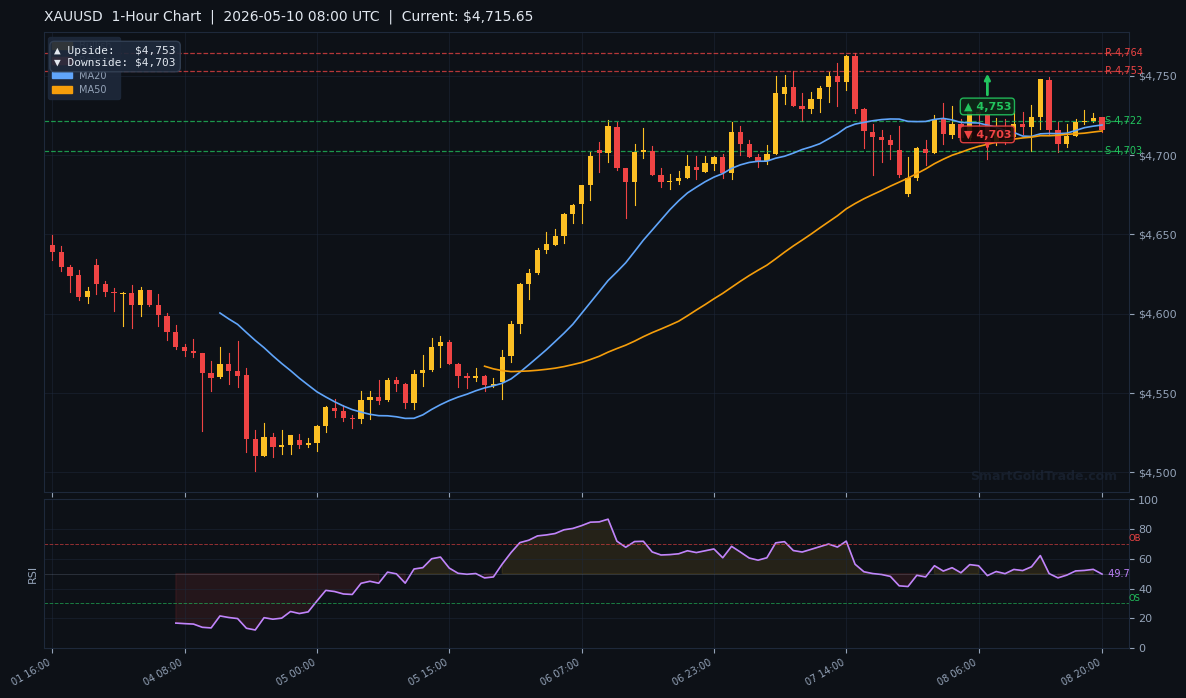
Key Support and Resistance Levels
Immediate resistance lies at $4,745.97 (R1) and the 4‑hour pivot target of $4,746. A break above opens the door to the 1‑hour target of $4,753 and the daily upside target of $4,857. On the downside, support at $4,702.94 (S1) and $4,669.34 (S2) are the first lines of defense. The 4‑hour and 1‑hour downside targets converge at $4,703. A daily close below $4,667 (daily downside target) would invalidate the bullish structure.
Given the ATR(14) of $13.57, the expected daily range is roughly $27. This week’s projected weekly range, based on ATR expansion, spans from $4,667 to $4,857, aligning perfectly with the pivot targets.
Trading Scenarios This Week
Bullish Scenario (Probability 55%)
Trigger: Price holds above $4,703 (S1) and breaks above $4,746 (R1) with strong volume, preferably after a soft CPI print or dovish Fed minutes. Entry zone: $4,710–$4,720. Target: $4,857 (daily upside pivot). Stop loss: Below $4,667.
Bearish Scenario (Probability 30%)
Trigger: CPI or retail sales beat forecasts, or Fed minutes reveal a less dovish stance than priced. A break below $4,703 and then $4,669 would confirm weakness. Entry zone: $4,680–$4,690 on a retest of broken support. Target: $4,667 (daily downside pivot). Stop loss: Above $4,722.
Neutral / Range‑Bound Scenario (Probability 15%)
If data comes in mixed and Hormuz tensions do not escalate further, gold may consolidate between $4,703 and $4,746. A mean‑reversion strategy selling near $4,740 and buying near $4,710 with tight stops can capture daily swings. Use the ATR of $13.6 to set profit targets.
Risk Factors to Watch
The primary black swan risk is an unexpected military confrontation in the Persian Gulf, which could send gold above $5,000 in a flash. Conversely, a surprise ceasefire or de‑escalation could trigger a $200+ selloff as risk appetite returns. On the data side, a CPI above 3.2% would shatter rate‑cut hopes and likely drive gold below $4,600. Traders should watch the $4,667 level as the bull‑bear line in the sand. A sudden dovish twist from the Fed, perhaps signaling an emergency rate cut, could accelerate gold toward $5,000, while a hawkish lean would test the bears’ resolve around $4,600.
Key Takeaways
- Gold holds above all key moving averages – trend is bullish.
- Immediate resistance at $4,746; break opens path to $4,857.
- Key support at $4,703 (S1); if lost, $4,667 is the critical floor.
- US CPI on Tuesday and Fed minutes on Wednesday are the most impactful events.
- RSI at 62.5 leaves room for rally without being overbought.
- Geopolitical risk from Hormuz tensions remains a wild card for both directions.
Halal Trading Strategy for This Gold Price Forecast Next Week
With a bullish bias above $4,703, Shariah-conscious traders can plan their moves in a riba-free environment. SmartGoldTrade’s halal gold trading platform lets you trade spot gold with full physical backing—no overnight interest, no leverage. If the bullish scenario plays out, consider taking long positions after a confirmed break of $4,746, and always use a stop below $4,667 to protect capital.
For investors who prefer a longer-term store of value, purchase certified gold coins and bars from our physical gold store. Owning 24K bars or 22K coins hedges against dollar weakness without exposing you to the volatility of short-term price swings, perfectly aligned with Islamic finance principles.
Conclusion
The gold market enters the week with a clear bullish bias on the daily chart, underpinned by a weak US Dollar and elevated safe‑haven demand. The $4,722–$4,746 zone is the