
Gold Price Forecast: Is $4,838 the Next Target Before the Fed?
The gold price opened the American session at $4,684.05, hovering just above the critical daily downside pivot of $4,683. Early Asian trade saw the metal slip alongside a firmer US dollar and rising Treasury yields, driven by higher oil prices and risk-off sentiment after heavy foreign equity outflows in South Korea. Despite the intraday pressure, bulls have so far defended the $4,683 level, keeping the door open for a potential bounce toward the daily upside target of $4,838.
With the Federal Reserve maintaining a neutral stance and inflation data already digested, the focus now shifts to how gold reacts to the ongoing liquidity squeeze in Asia. The coming hours will determine whether the gold price can reclaim short-term moving averages or if a breakdown below $4,683 triggers accelerated selling.
Gold Market Overview
Macro Context
The US Dollar Index (DXY) gained ground during the Asian session as risk appetite deteriorated. Higher crude oil prices, following OPEC+ supply concerns, added to inflationary fears and pushed US 10-year Treasury yields above 4.35%. This combination typically weighs on gold, and indeed the XAU/USD pair slipped from its overnight highs. The South Korean Won led Asian FX losses, reflecting broader capital outflows that also pressured emerging market currencies.
Session Outlook
The American session brings renewed liquidity and potential volatility. Key levels to watch are $4,683 as immediate support and $4,703 (MA20) as the first resistance. A break above $4,703 would flip short-term momentum bullish, while a sustained move below $4,683 could open the path to $4,667. Traders should also monitor any Fed-speak or US Treasury auction results that might shift yield dynamics.
Technical Analysis
Moving Average Structure
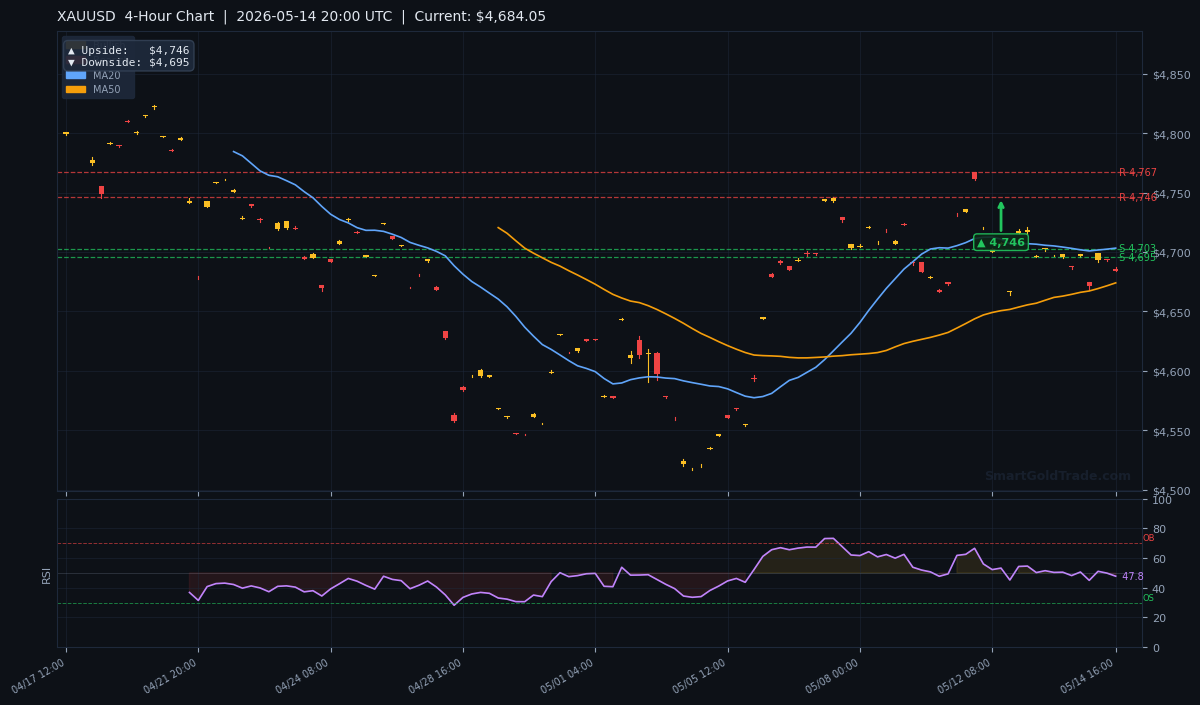
The MA20 sits at $4,703.27, with the current gold price of $4,684.05 trading below it—indicating bearish short-term momentum. The MA50 at $4,674.05 provides mid-term support, and the MA200 at $4,697.79 remains above price, confirming a longer-term bearish structure. However, the EMA structure shows MA20 > MA50, which signals short-term bullish momentum if price can reclaim the 20-period average.
RSI and Momentum
The RSI(14) stands at 47.8, squarely in neutral territory. This gives neither bulls nor bears a clear advantage, meaning the market is waiting for a catalyst. The ATR(14) of $17.54 suggests an expected daily range of roughly $17–18 from current levels, with potential for expansion during high-impact news.
Key Price Levels
| Timeframe | Upside Target | Downside Target |
|---|---|---|
| Daily | $4,838 | $4,683 |
| 4-Hour | $4,746 | $4,695 |
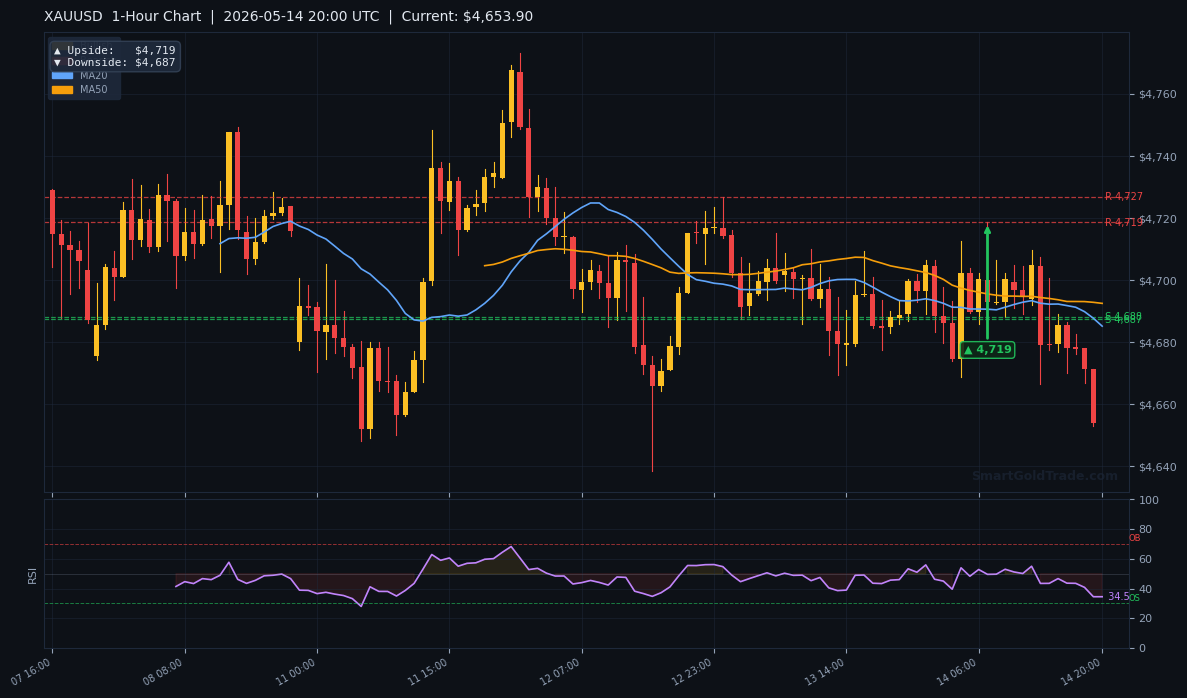
| 1-Hour | $4,719 | $4,687 |
Support levels from the indicators: S1 $4,702.94, S2 $4,695.39. Resistance levels: R1 $4,767.25, R2 $4,745.97.
Fundamental Drivers
Macro Catalyst: Asian Risk-Off Spillover
The primary fundamental driving today's gold price action is the risk-off environment that started in Asia. OCBC’s Christopher Wong noted that the South Korean Won led declines in regional currencies, pressured by higher oil prices, firmer US Treasury yields, and heavy foreign equity outflows. This risk aversion typically benefits the US dollar at gold’s expense in the short term.
Additionally, the Federal Reserve’s neutral stance—confirmed by recent minutes—has removed the urgency for rate cuts, keeping real yields elevated. Gold’s path lower this morning reflects this headwind.
Key Event to Watch
Later this week, traders will watch for any Fed commentary that could shift expectations. A hawkish tone would likely push the gold price below $4,683, while a dovish lean could fuel a rally toward $4,746. US jobless claims data (if scheduled) may also provide short-term volatility.
Devil's Advocate
The bearish bias could be invalidated if the gold price breaks above the MA20 at $4,703.27 during the American session. That would flip the short-term EMA structure fully bullish and likely trigger short-covering toward $4,746. Conversely, if risk appetite returns and equity markets bounce, gold’s safe-haven appeal may wane further, accelerating the breakdown below $4,683.
Watch the $4,695–$4,703 zone as the battleground. A decisive close above $4,703 invalidates the immediate bearish setup.
Trading Strategy for American Session
For traders looking to capitalize on the current setup, consider a short bias as long as gold price stays below $4,703.
- Entry zone: $4,683–$4,695 (near S2 support).
- Stop loss: above $4,703 (MA20) or use a 1.5× ATR buffer (~$26), placing it near $4,710.
- Take profit target 1: $4,667 (previous swing low). Target 2: $4,640 (extension).
For a long setup, wait for a confirmed break above $4,703 with volume. Entry: $4,705–$4,710. Stop: below $4,683. Target: $4,746 (4H resistance) and $4,838 (daily pivot). Traders seeking a passive approach can explore copy trading to mirror expert strategies without manual execution.
Key Takeaways
- Gold price is trading at $4,684.05, just above the daily downside pivot of $4,683.
- Short-term trend is bearish with price below MA20 ($4,703.27) and MA200 ($4,697.79).
- RSI at 47.8 indicates neutral momentum, leaving room for either direction.
- Resistance levels: $4,703 (MA20), $4,746 (4H target), $4,838 (daily target).
- Support levels: $4,683 (daily pivot), $4,667 (next major support).
- A break above $4,703 flips bias bullish; a break below $4,683 opens door to $4,667.
Conclusion
The gold price is at a decision point. The immediate bias is bearish below $4,703, but the defense of $4,683 suggests buyers are not ready to give up. A clean break above $4,703 would shift the short-term momentum back in favor of bulls, targeting $4,746 and eventually $4,838. Conversely, a failure to hold $4,683 could lead to a swift decline toward $4,667. The American session will be the arbiter, so watch the key levels closely.
Frequently Asked Questions
- What is the current gold price?
- The current gold price (XAU/USD) is $4,684.05 as of the American session on May 14, 2026.
- What are the key support and resistance levels for gold right now?
- Immediate support is at $4,683 (daily downside pivot), followed by $4,667. Resistance starts at $4,703 (MA20), then $4,746 (4-hour target) and $4,838 (daily target).
- Is gold bullish or bearish today?
- Short-term bias is bearish as price trades below MA20 and MA200. However, the RSI is neutral, and gold is testing a key support level, so a bounce is possible. The trend will be confirmed by whether price stays below $4,703 or breaks above it.
- What time does the American session for gold trading start?
- The American session for gold (XAU/USD) typically runs from 8:00 AM to 5:00 PM EST (New York time). The most liquid and volatile period is during the overlap with London (8:00 AM–12:00 PM EST).
Risk Disclaimer: Trading Gold (XAU/USD) carries significant risk of loss and is not suitable for all investors. This content is for informational purposes only and does not constitute financial advice. Always conduct your own research and trade responsibly.