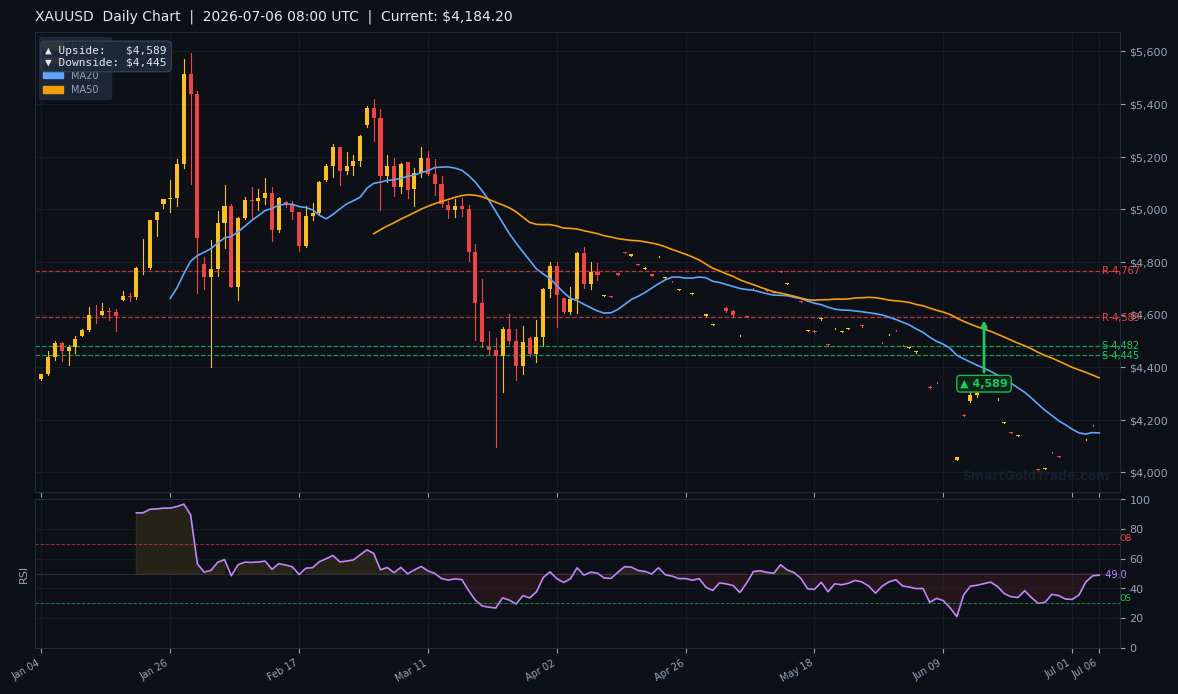
Gold Market Overview
Macro Context
The dollar index remains subdued after Friday’s jobs miss, hovering near 101.7 as traders price in a higher probability of a September rate cut. The 10-year US Treasury yield has slipped to 4.12%, down 7 basis points from last week, reinforcing the opportunity cost advantage for non-yielding bullion. Geopolitically, renewed rhetoric around US debt ceiling negotiations and central bank gold purchases—particularly from the People’s Bank of China—continue to underpin the gold price at these elevated levels. The market is also digesting last week’s FOMC minutes from the June meeting, which revealed a growing split among policymakers on the timing of cuts, but ultimately leaned dovish.
Session Outlook
The European session is opening with a burst of activity as traders return from the holiday-thinned Asian hours. Liquidity is normalising, and the gold price is already testing the first intraday resistance at $4,184. With little tier-one data on the docket today, price action will be driven overwhelmingly by technical flows and positioning ahead of tomorrow’s FOMC minutes release. Expect the range to be bounded by $4,164.51 support and the $4,184 resistance cluster, though a break in either direction could easily stretch the range to the ATR-implied boundaries of $4,145 to $4,200. The bullish bias remains intact as long as the $4,164 floor holds.
Technical Analysis
Moving Average Structure
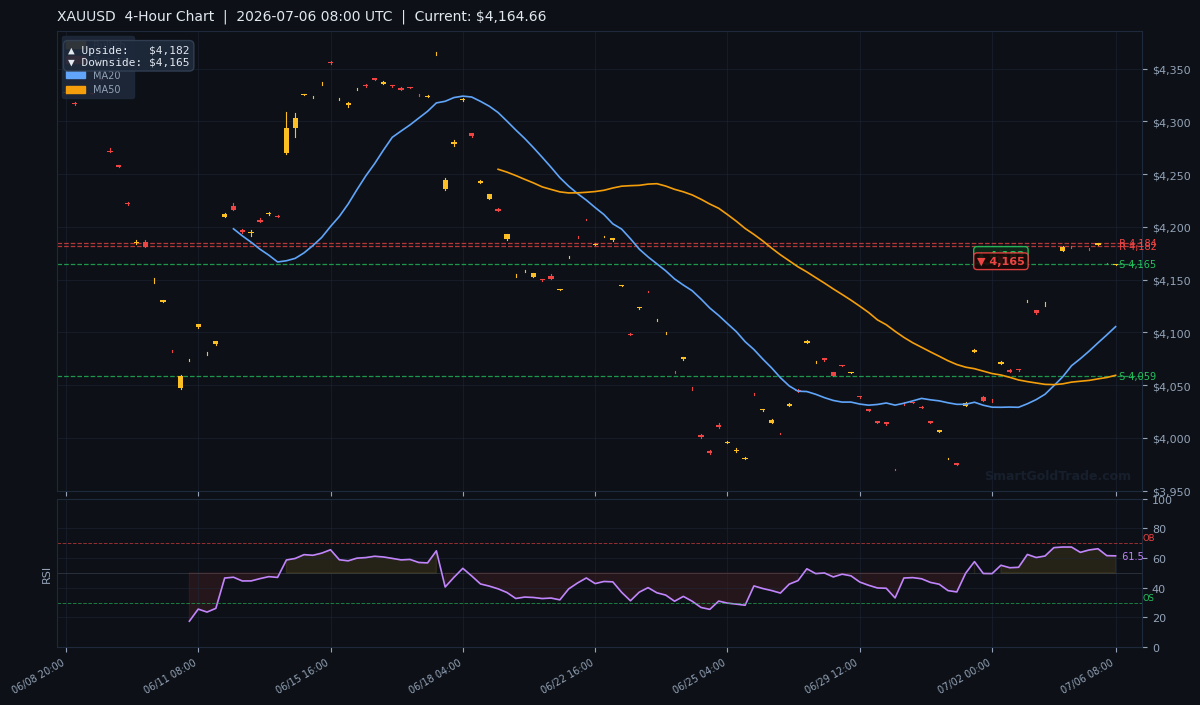
The gold price at $4,164.66 sits firmly above both the 20-period MA at $4,105.49 and the 50-period MA at $4,059.35. This MA20 > MA50 alignment is the textbook definition of short-term bullish momentum and typically attracts trend-following buyers on pullbacks. However, the 200-period MA at $4,286.62 looms far above, meaning the broader trend on the daily chart remains bearish. This structural conflict—bullish on the H4, bearish on the D1—frequently produces sharp reversals near key resistance levels, making $4,184 a make-or-break zone. A daily close above the 200-MA would be required to confirm a longer-term trend change.
RSI and Momentum
The 14-period RSI reads 61.5, firmly in neutral territory but with a clear upward slope. It is far from overbought, leaving plenty of room for additional buying before any exhaustion signal appears. Coupled with the bullish EMA crossover, this RSI level suggests that the rally has not yet reached a climax. Momentum chasers will be watching for a push above 70 on the RSI to confirm breakout strength, while reversal traders will be alert for any bearish divergence on the lower timeframes near the $4,184 area.
Key Price Levels
Immediate support sits at $4,164.51, practically the current price, making it the session’s pivotal line-in-the-sand. Below that, $4,097.28 provides a deeper safety net and aligns with the 50-MA. Resistance is stacked at $4,184.32 (R1) and $4,181.55 (R2), forming a tight supply zone where sellers may appear. The ATR of $18.07 implies a normalised intraday range of roughly $18, suggesting that a break above resistance could carry price toward the $4,200 handle, while a failure could send it back to $4,145. The H4 pivot analysis projects an upside target of $4,182 and a downside target of $4,165, both in harmony with the static S/R levels.
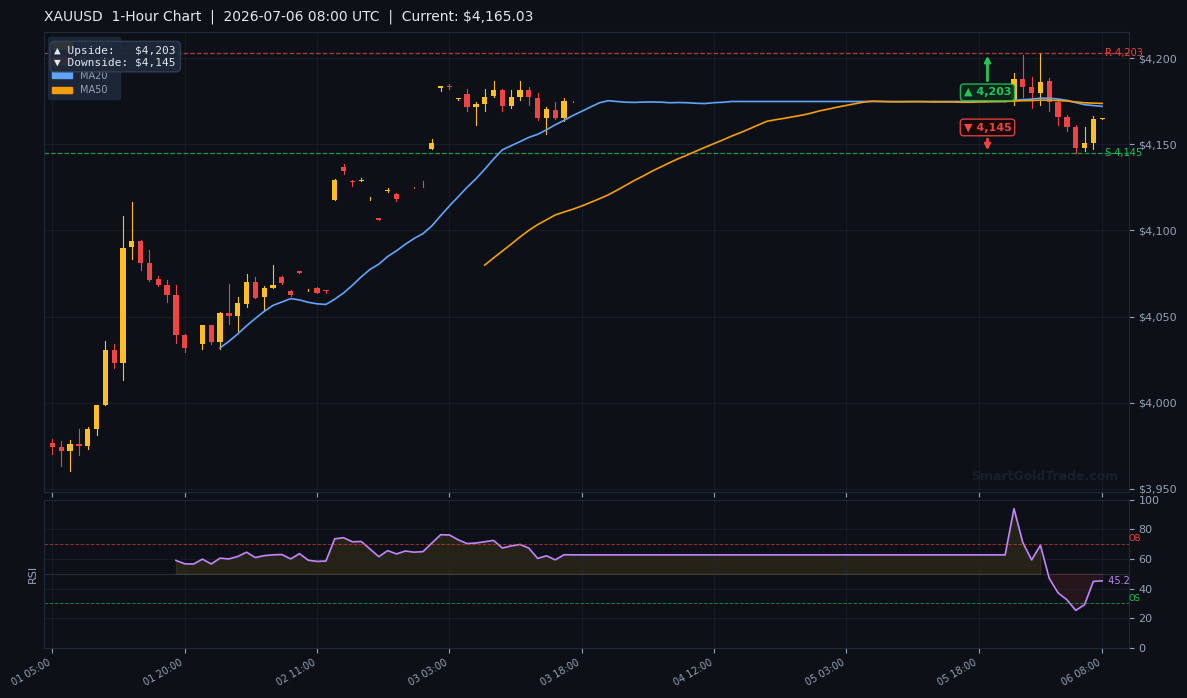
| Timeframe | Upside Target | Downside Target |
|---|---|---|
| Daily (D1) | $4,589 | $4,445 |
| 4-Hour (H4) | $4,182 | $4,165 |
| 1-Hour (H1) | $4,203 | $4,145 |
Fundamental Drivers
Tomorrow’s release of the FOMC minutes from the June 16–17 meeting is the primary risk event on traders’ radars. Already, the post-NFP dovish repricing has fueled the gold price rally, and any confirmation that committee members are coalescing around a September cut could easily trigger a move toward the daily upside target of $4,589. Conversely, hawkish dissent documented in the minutes could spark a sharp reversal, particularly given the technical resistance at $4,184. The US debt trajectory and its effect on global reserve diversification continue to provide a medium-term bid; several emerging market central banks have accelerated gold purchases, a theme FXLeaders highlighted last week in noting that “US debt forces central banks to increase gold focus.”
Key Event to Watch
The FOMC minutes, due July 7 at 2:00 PM ET, will be the single most impactful data point this week. Market pricing now assigns a 62% probability to a 25-basis-point cut in September, and any hint of a larger faction favouring an earlier move could unwind long-USD positions rapidly. Gold traders should mark $4,164 and $4,184 as the pre-release pivot zone; a breakout before the minutes often telegraphs the post-news direction.
Devil's Advocate
A daily close back below $4,164.51 would negate the immediate bullish bias and open the door to a retest of $4,097.28. More dangerously, if the FOMC minutes reveal a reluctance to cut rates despite softer labour data, the dollar could spike and drag the gold price toward the H1 downside target of $4,145. The fact that price remains below the 200-MA at $4,286.62 means this rally is still a counter-trend move on the daily timeframe; false breaks into longer-term resistance are common in such setups. A rejection at $4,184 with an RSI bearish divergence would be a high-probability short signal for aggressive counter-trend traders. In addition, the 200-MA overhead means that even a break above $4,184 may not sustain if the daily bearish structure reasserts itself, so aggressive longs should protect profits with trailing stops.
Trading Strategy for European Session
Given the bullish EMA structure and the momentum into London, the favoured approach is to buy pullbacks. An entry zone between $4,164 and $4,165 offers a logical low-risk spot, right on the session support and the H4 downside pivot. A stop loss placed below $4,097—under the S2 level and the 50-MA—provides a cushion of roughly $67, just under 4 times the ATR, which is wide enough to avoid noise but protects capital if the structure breaks. The first take-profit target is the H4 upside pivot at $4,182, with a second target at the R1 resistance of $4,184.
For traders who prefer a more aggressive setup, a confirmed breakout with a 15-minute close above $4,184.32 could be chased toward the H1 target of $4,203, though this requires real-time confirmation.
For those seeking a Shariah-compliant way to execute these levels, our halal gold trading platform offers spot gold ownership without swaps or interest, ensuring every trade aligns with Islamic finance principles. Alternatively, if you’d rather not manage entries and stops yourself, you can follow top gold traders via our copy trading service, which automates position mirroring while keeping everything fully Shariah-compliant. Meanwhile, institutional-grade entry precision can be enhanced by following alerts; many traders trust InvestorTipster’s professional gold trading signals to pinpoint entries just like this.
Key Takeaways
- The gold price at $4,164.66 is testing the critical $4,184 resistance zone during European trade.
- Short-term MAs confirm bullish momentum, with MA20 at $4,105.49 and MA50 at $4,059.35 sloping higher.
- RSI(14) at 61.5 leaves room for further upside before overbought conditions emerge.
- ATR of $18.07 suggests a normal session range between $4,145 and $4,200.
- Tomorrow's FOMC minutes represent a binary risk; dovish wording could propel price toward the daily target of $4,589.
- A daily close below $4,164 would flip the short-term bias bearish, opening $4,097 as the next support.
Gold Price Outlook
The European session is set to revolve entirely around how the gold price interacts with the $4,184 ceiling. Bullish momentum from the moving averages and a neutral RSI give buyers the edge, but the longer-term bearish structure above $4,286 cannot be ignored. A clean break and hold above $4,184 opens the path to $4,200 and eventually the daily pivot at $4,589; failure here, especially if accompanied by hawkish FOMC minutes, could retest $4,164 and $4,097. The next 48 hours will demand discipline, clearly defined levels, and a willingness to adapt if the macro background shifts. For traders navigating this thin-liquidity environment, maintaining strict risk parameters and not over-leveraging will be essential—as will having a Shariah-compliant vehicle that eliminates swaps and interest.
FAQ
What is the most important level for the gold price today?
Resistance at $4,184.32 is the session's make-or-break level. A break above it would likely accelerate buying toward $4,200 and the H1 target of $4,203, while a rejection could send price back to $4,164 support.
How does the moving average structure influence gold's direction?
With price trading above both the 20-MA ($4,105.49) and 50-MA ($4,059.35), the short-term trend is bullish. However, the 200-MA at $4,286.62 is still overhead, meaning the broader trend remains bearish and any rally faces significant long-term resistance.
What event could change the gold price trend this week?
The FOMC minutes scheduled for July 7 are the primary catalyst. Dovish revelations could push XAU/USD toward the daily upside target of $4,589; hawkish details could trigger a slide back to $4,145 or lower.