
The gold price hovers at $4,752.59 in the early Asian session, a level that defines the current tug-of-war between short-term bullish momentum and enduring long-term resistance. Last week's spike in oil prices provided a temporary haven bid, but that macro tailwind has faded with the morning's thinner volumes. For traders now, the session ahead is about patience and precise level-watching, not aggressive positioning.
The market structure presents a mixed picture. Price action sits comfortably above its short and medium-term moving averages, suggesting underlying strength. However, the formidable 200-day average overhead acts as a ceiling that has capped rallies for weeks. This leaves gold in a consolidation phase, awaiting a fundamental catalyst or a technical breakout to define the next major directional move.
With liquidity at its daily low during the Asian hours, expect exaggerated reactions to any sudden orders. The primary objective is to monitor how price interacts with the immediate technical levels—particularly the first line of support at $4,730.58. A calm, strategic approach that respects the session's inherent limitations is paramount.
Gold Market Overview
Macro Context
The US Dollar Index (DXY) remains the primary external driver for gold. Its recent strength, bolstered by resilient US Treasury yields and a Federal Reserve committed to its data-dependent stance, continues to apply passive pressure. Geopolitical tensions, while ever-present, have moved to a simmer rather than a boil, reducing their immediate safe-haven premium. The primary narrative remains centered on the timing and pace of future Fed policy shifts, with every data point scrutinized for its inflationary implications.
This week, traders will watch for further commentary from Federal Reserve officials and any unexpected developments in global risk sentiment. The core dynamic is unchanged: gold struggles to sustain rallies when real yields offer a competitive, risk-free return. Until that calculus shifts, rallies are likely to be sold into strength near key resistance zones.
Session Outlook
The Asian session is characterized by lower liquidity and participation compared to the London or New York overlaps. This environment often leads to tighter, range-bound price action but can also produce sharp, short-lived spikes if a large order hits the market. Major economic data releases are absent during these hours, leaving price movement to be driven by technical flows and any breaking geopolitical headlines.
Given the Average True Range (ATR) of $30.83, the expected daily volatility band is wide. However, in Asia, only a fraction of that range is typically realized. Traders should prepare for a likely consolidation range between the first support ($4,730.58) and the first resistance ($4,801.26). The key is to identify high-probability setups at these boundaries, not to chase moves in the middle of the range.
Technical Analysis
Moving Average Structure
The moving average configuration reveals the market's conflicting signals. The short-term MA20 sits at $4,739.09, with the price currently above it, confirming a bullish near-term bias. The medium-term MA50 at $4,717.28 is also well below the current price, reinforcing positive momentum on the 4-hour to daily charts. However, the long-term MA200 at $4,854.09 looms overhead. The price trading below this key level places gold in a broader bearish territory. The structure of MA20 > MA50 confirms short-term bullish momentum, but the battle is against the dominant MA200 resistance.
RSI and Momentum
The Relative Strength Index (14) reads 54.4, placing it squarely in neutral territory. This indicator shows no overbought or oversold extremes, offering no clear contrarian signal for entry or exit. It suggests the market has room to move in either direction before becoming stretched. The neutral RSI, combined with the price's position between key moving averages, indicates a market in balance, waiting for the next push from fundamentals or a technical breakout.
Key Price Levels
Our analysis identifies clear, actionable levels derived from live market data. Immediate support is found at S1: $4,730.58, followed by a stronger floor at S2: $4,705.44. On the upside, the first hurdle for bulls is R1: $4,801.26, with the more significant barrier at R2: $4,857.30—the latter aligning closely with the MA200. The ATR(14) value of $30.83 sets the expected daily volatility range, a crucial metric for setting appropriate stop losses and profit targets. The following table summarizes the critical pivot levels across timeframes:
| Timeframe | Upside Target | Downside Target |
|---|---|---|
| Daily Chart | $5,250 | $5,014 |
| 4-Hour Chart | $4,801 | $4,731 |
| 1-Hour Chart | $4,795 | $4,751 |
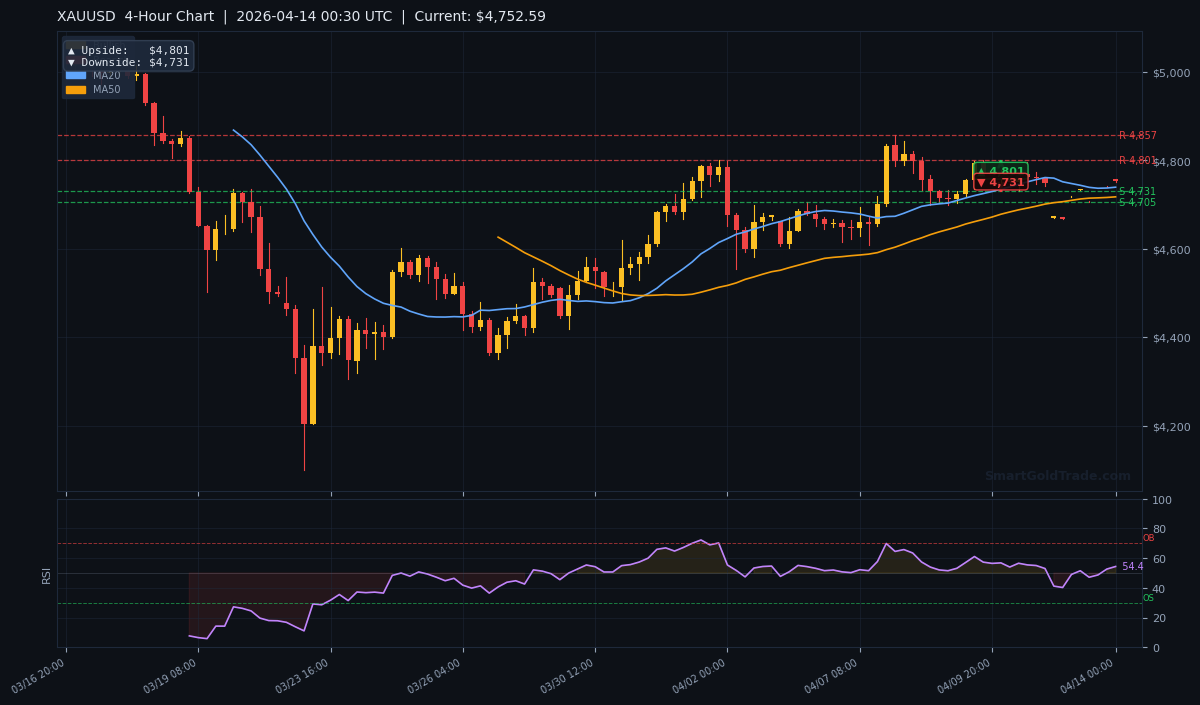
The 4-hour chart illustrates the consolidation zone perfectly, bounded by the support near $4,730 and resistance approaching $4,800. The convergence of the MA20 and MA50 provides dynamic support beneath the price.
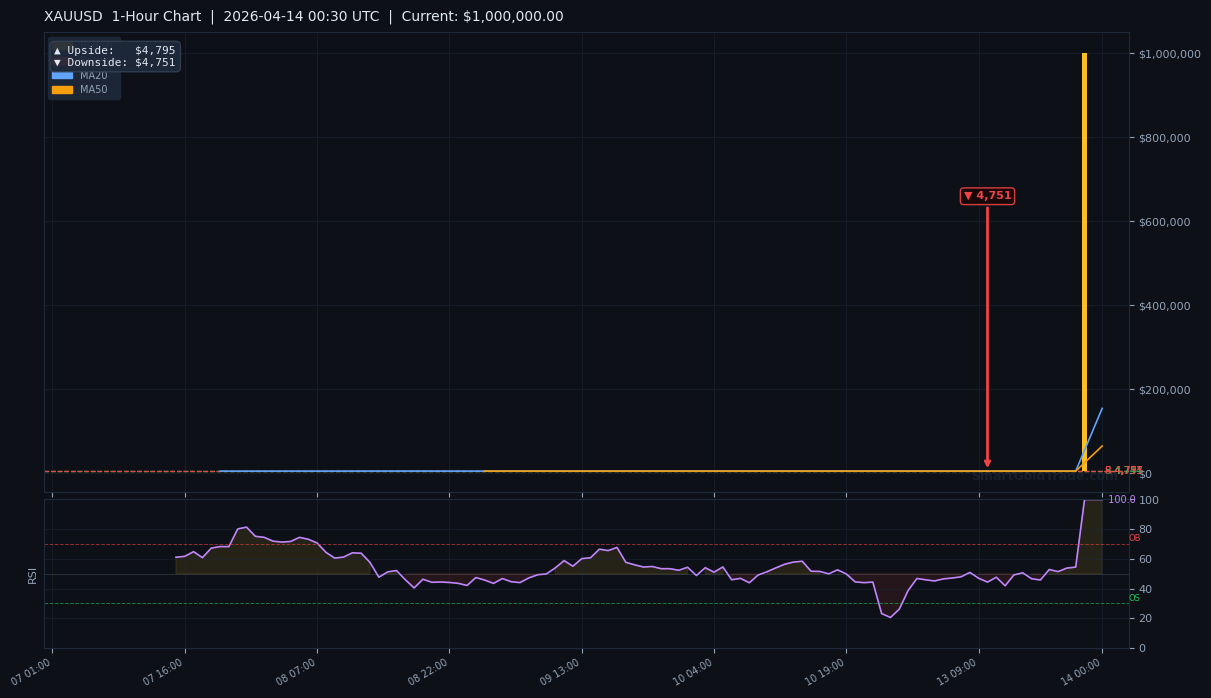
The 1-hour chart offers a granular view of the immediate battle. The price is testing the upper boundary of its recent micro-range, with the $4,751 to $4,795 zone containing the action. This is the map for intra-session scalpers.
Fundamental Drivers
The primary fundamental tension remains between persistent inflation concerns—which historically support gold—and the Federal Reserve's responsive higher interest rates, which increase the opportunity cost of holding the non-yielding metal. Last week's oil price surge reintroduced inflationary fears into the market, providing a brief lift for gold as a traditional hedge. However, as oil stabilizes, that specific catalyst has diminished.
The correlation with the US Dollar is inverse and critical. Any renewed dollar strength, perhaps from hawkish Fed rhetoric or strong US economic data, would pressure gold towards its supports. Conversely, a dovish shift in tone or weak data could weaken the dollar and propel gold toward R1 at $4,801.26. Geopolitical risk is a constant background factor but requires a significant escalation to become the main price driver.
Key Event to Watch
The single most important event this week will be the release of US Retail Sales data. As a direct indicator of consumer health and inflationary pressures, a significantly stronger-than-expected print could reinforce expectations of a 'higher for longer' Fed rate path, boosting the dollar and pressuring gold. A weak print, however, could fuel hopes for earlier policy easing, potentially weakening the dollar and giving gold the catalyst it needs to challenge the $4,800 resistance. Traders should adjust their positioning and exposure ahead of this release.
Devil's Advocate
The prevailing short-term bullish momentum is not without risks. The most straightforward invalidation of the current bullish setup would be a sustained break and close below the $4,730.58 (S1) support level. This would signal that the buying pressure above the MA20 has been exhausted and that sellers are regaining control. Such a move would likely target the next support at $4,705.44 (S2).
A break below S2 would not only flip the short-term bias to bearish but could also trigger a deeper retracement toward the MA50 near $4,717. This scenario would most likely be triggered by a sharp, unexpected spike in the US dollar or a hawkish surprise from a Fed speaker. Always have a plan for the thesis being wrong.
Trading Strategy for Asian Session
Given the thin liquidity and consolidating nature of the Asian session, a patient, level-based strategy is optimal. The preferred approach is to wait for a retest of the identified support zone before considering a long position. A buy limit order can be placed in the region of $4,732 - $4,736, anticipating a bounce from the confluence of S1 and the rising MA20.
A conservative stop loss should be placed just below S2 at $4,700, a $32 risk that aligns with the daily ATR. The primary take-profit target is the first resistance at $4,801.26 (R1), offering a favorable risk-reward ratio. A more aggressive partial profit can be taken at the 1-hour chart's upside target of $4,795. For those considering a short trade, only a clear break and hold below $4,730 would offer a valid signal, targeting $4,705 with a stop above $4,745.
Key Takeaways
- The gold price is in a short-term bullish structure but faces major long-term resistance below the MA200 at $4,854.09.
- Immediate critical support rests at $4,730.58 (S1); a break here would invalidate the near-term bullish bias.
- The neutral RSI at 54.4 indicates room for movement in either direction without being overextended.
- The Asian session's low volatility calls for patience—focus on set-ups at key levels, not chasing prices.
- The 4-hour chart provides the clearest framework, with a defined range between $4,731 and $4,801.
- Upcoming US Retail Sales data is the key fundamental catalyst to watch this week for a potential breakout.
Conclusion
Gold price action is at a tactical crossroads, balancing positive short-term momentum against a formidable wall of long-term resistance. The current posture favors a cautiously bullish approach, but only from well-defined support levels. The $4,730 level is the linchpin; holding above it keeps the path open toward $4,801 and potentially higher. Breaking below it shifts the advantage to sellers. In the quiet Asian hours, discipline and level-awareness are your greatest allies. Monitor price reactions at these technical frontiers, and let the market show its hand before committing significant capital. The larger trend will be decided by the coming fundamental data.
Frequently Asked Questions
- Is gold in a bull or bear market right now?
- It depends on the timeframe. On a long-term daily chart, gold is in a bearish phase as it trades below the 200-day moving average at $4,854.09. However, on shorter timeframes (4-hour and 1-hour), it exhibits bullish momentum as it holds above the MA20 at $4,739.09 and MA50 at $4,717.28.
- What is the most important gold price level to watch today?
- The most critical level during the April 14 Asian session is support at $4,730.58. A sustained break below this level would signal a shift in short-term momentum from bullish to bearish and could trigger a move down to $4,705.44.
- How much volatility should I expect in gold today?
- Based on the Average True Range (ATR) indicator of $30.83, the expected daily trading range is approximately $31. However, during the low-liquidity Asian session, realized volatility is often a fraction of this full daily range.
- What's a good risk-reward trade setup for gold currently?
- A potential setup is to buy on a dip to the $4,732 - $4,736 zone, with a stop loss at $4,700 and a take-profit target at $4,801. This offers a risk of about $32 for a potential reward of about $65, a risk-reward ratio of roughly 1:2.
Risk Disclaimer: Trading Gold (XAU/USD) carries significant risk of loss and is not suitable for all investors. This content is for informational purposes only and does not constitute financial advice. Always conduct your own research and trade responsibly.