
Gold Price Warning: $4,667 Support at Risk After Canada CPI
The gold price opened the European session at $4,477.84, extending its slide after yesterday's Canada Consumer Price Index release. April headline CPI rose 0.4% month-on-month, marginally above expectations, reinforcing the Bank of Canada's cautious stance. While the immediate reaction was muted for gold, the existing bearish technical structure accelerated the decline.
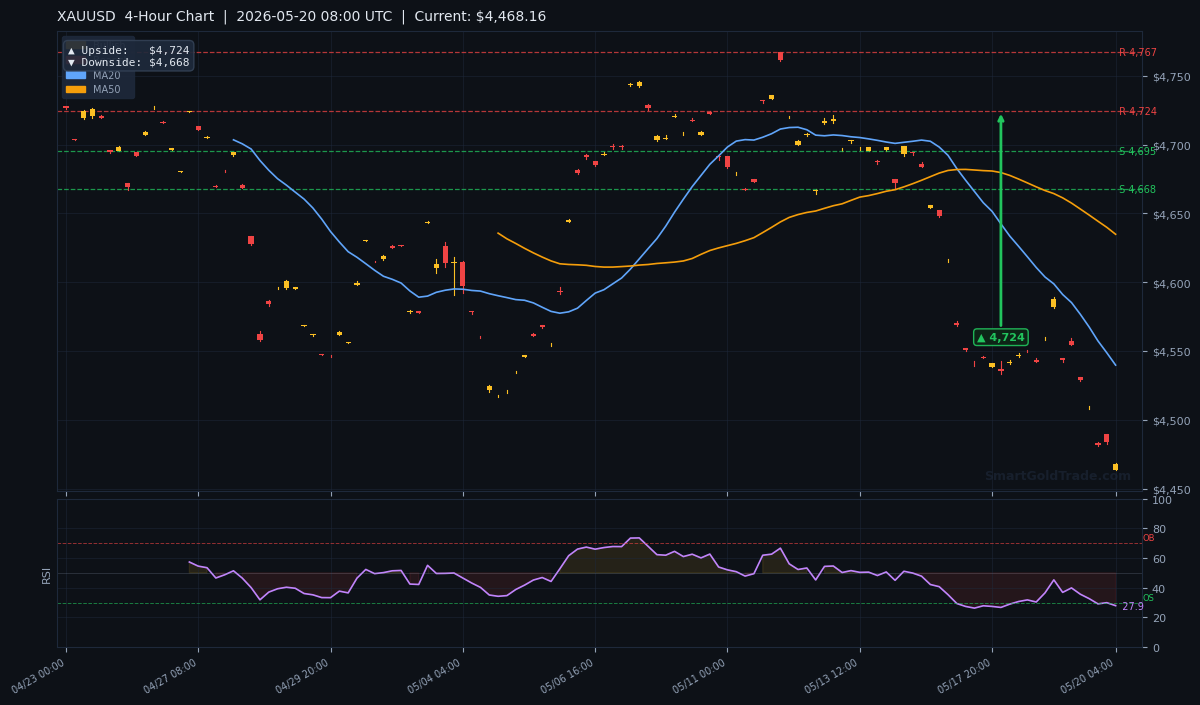
With the RSI at 27.9 — deep into oversold territory — a bounce is possible, but the trend remains firmly lower. This session, traders must watch the $4,667 daily downside target; a break below that could open the door to $4,531.
Gold Market Overview
Macro Context
The U.S. Dollar Index (DXY) continues to grind higher near 100.50, pressuring gold as a non-yielding asset. U.S. 10-year Treasury yields held at 4.35% overnight, adding headwinds. The Federal Reserve's latest minutes confirmed a cautious pivot, with no rate cuts priced in until Q4 2026. This hawkish repricing has stripped gold of its safe-haven appeal in the near term.
Geopolitical risks remain elevated — Middle East tensions and trade uncertainty between the U.S. and EU — but gold has failed to attract bids. The correlation with risk assets has broken; equities are flat while gold bleeds, a sign of forced liquidation or margin calls.
Session Outlook
European liquidity is ramping up as London opens. Expect intraday volatility to expand, with the ATR of $17.83 suggesting a daily range near $36. The session bias is bearish below the $4,539.74 MA20. A retest of $4,667 remains the path of least resistance unless buyers reclaim $4,702.94 (S1).
Technical Analysis
All timeframes align bearish, with the gold price trading below every key moving average. The MA20 sits at $4,539.74, MA50 at $4,634.83, and MA200 at $4,686.83. This negative stack confirms a sustained downtrend. The RSI(14) at 27.9 is the only bullish divergence — price is now oversold, historically a precursor to a short-term bounce. However, oversold does not mean reversal; bears can persist in oversold conditions.
Moving Average Structure
The MA20 ($4,539.74) is below the MA50 ($4,634.83), which is below the MA200 ($4,686.83). This classic death cross arrangement has been in place since early May. Each failed attempt to break above the MA20 reinforces the downtrend. Until the gold price can close above $4,634.83 on a daily basis, any rally remains a countertrend move.
RSI and Momentum
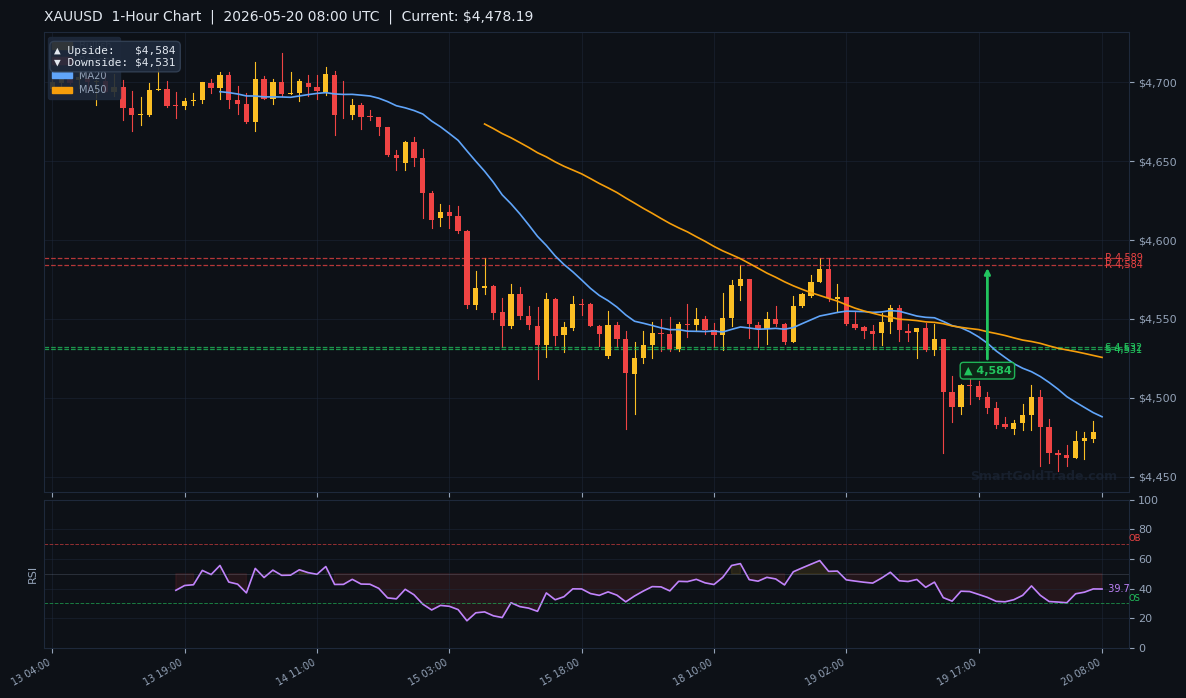
The RSI(14) at 27.9 is the lowest reading since March 2026. This suggests sellers are exhausted in the short term, but momentum oscillators can remain oversold during strong trends. A bullish divergence on lower timeframes (1H and 4H) is forming, which could produce a snap rally of $20–$30 before resuming the slide. Traders should not anticipate a major reversal unless RSI climbs above 40.
Key Price Levels
From the live indicator data: Support S1 is $4,702.94, S2 at $4,695.39. Resistance R1 at $4,767.25, R2 at $4,745.97. The pivot arrow targets from charts add: Daily upside $4,838, downside $4,667; 4H upside $4,724, downside $4,668; 1H upside $4,584, downside $4,531. The most immediate battle is between $4,668 (4H pivot) and $4,531 (1H pivot).
| Timeframe | Upside Target | Downside Target |
|---|---|---|
| Daily | $4,838 | $4,667 |
| 4-Hour | $4,724 | $4,668 |
| 1-Hour | $4,584 | $4,531 |
Fundamental Drivers
Yesterday's Canada CPI release for April was the major event. Headline inflation rose 0.4% month-on-month, bringing the annual rate to 2.9%, slightly above the Bank of Canada's 2% target. Core CPI was 0.3% MoM. The data reduces the likelihood of a July rate cut, strengthening the CAD and indirectly supporting the USD via cross-asset flows. For gold, higher real yields in Canada and the U.S. are a negative.
Key Event to Watch
Later this week, the focus shifts to the U.S. initial jobless claims report on Thursday and Fed Chair Powell's speech on Friday. If claims rise above 240K, gold could stage a relief rally towards $4,702. Conversely, a strong labor market would reinforce the 'higher for longer' narrative, pushing gold toward $4,667.
Devil's Advocate
The primary risk to the bearish bias is a sharp oversold bounce. The RSI at 27.9 has historically preceded $30–$50 rallies when combined with a bullish divergence on the 1H chart. If the gold price reclaims $4,702.94 (S1) during the European session, the breakdown scenario is invalidated. Bulls would then target $4,767.25. A close above the MA20 at $4,539.74 is needed to flip the short-term bias.
Trading Strategy for European Session
Given the oversold conditions, a short-only approach carries timing risk. We recommend a bearish bias with a tight stop. Entry zone: $4,475–$4,485 (current area). Stop loss: $4,505 (above the 1H 20-EMA, allowing $27. This provides a 1:3 risk-reward if the trade reaches $4,531. Take profit 1: $4,531 (1H downside pivot). Take profit 2: $4,667 (daily downside pivot). Position size should be limited to 1% risk per trade. For longer-term traders, a break below $4,667 could lead to a sustained move to $4,500, but that is a multi-day outlook.
If you prefer a hands-off approach, consider copy trading to mirror expert gold traders managing risk through this volatile period.
Key Takeaways
- The gold price is trading at $4,477.84, below all major moving averages — bearish territory.
- MA20 at $4,539.74, MA50 at $4,634.83, MA200 at $4,686.83 — death cross structure.
- RSI(14) at 27.9 — oversold, bounce potential but trend remains down.
- Immediate support at $4,667 (daily pivot); resistance at $4,702.94 (S1).
- ATR of $17.83 implies a daily range of ~$36 within the session.
- Break below $4,667 targets $4,531; reclaiming $4,702 invalidates the bearish setup.
Conclusion
The bearish case for gold remains intact after Canada's CPI data reinforced global tightening expectations. While oversold conditions may produce a short-term squeeze, the path of least resistance is lower toward $4,667. Traders should watch for a break of that level to confirm continuation or a reclaim of $4,703 to signal a potential trend change. This session, discipline and tight risk management are key.
Frequently Asked Questions
- What is the gold price right now?
- As of 08:00 UTC on May 20, 2026, the gold price is $4,477.84 per troy ounce during the European session.
- Will gold price drop to $4,500 today?
- If daily pivot support at $4,667 breaks, $4,531 is the next downside target, with $4,500 as a psychological level. A drop to $4,500 is possible within 2–3 sessions if bearish momentum continues.
- Is gold oversold and due for a bounce?
- The RSI(14) at 27.9 is oversold, which often leads to a short-term bounce. However, in strong downtrends, oversold conditions can persist. A bounce to $4,702 is possible but not guaranteed.
- What is the best gold trading strategy for today?
- Conservative traders should wait for a break below $4,667 to short toward $4,531 with a stop above $4,705. Aggressive traders can attempt a scalp long from $4,477 with a tight $20 stop, targeting $4,531.
Disclaimer: Trading Gold (XAU/USD) carries significant risk of loss and is not suitable for all investors. This content is for informational purposes only and does not constitute financial advice. Always conduct your own research and trade responsibly.